 CryptoChain Blog
Bitcoin Realized Price Divergences: 2026 Trading Signals
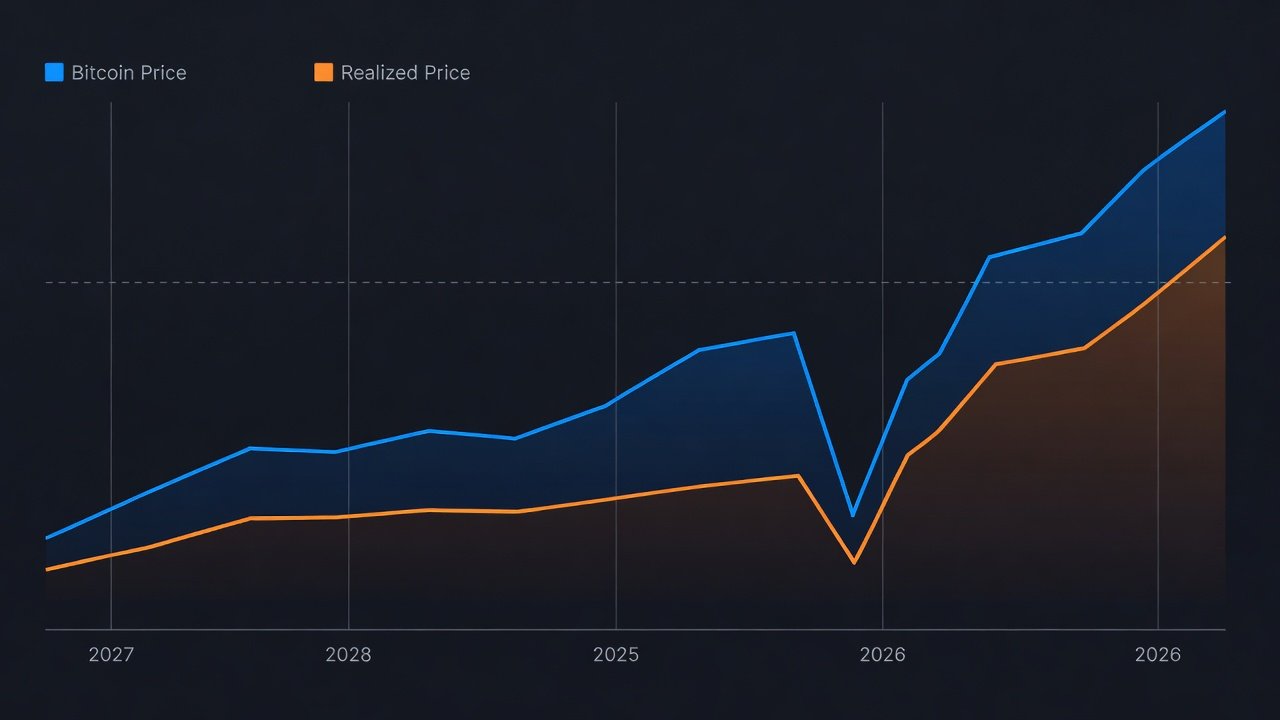
Bitcoin realized price divergences provide traders with a reliable framework for identifying potential market reversals and confirming underlying sentiment throughout 2026. Unlike traditional price charts that reflect only spot trading activity, realized price captures the aggregate cost basis of all Bitcoin in circulation by averaging the price at which each coin last moved on-chain. When market price moves significantly away from this realized benchmark, divergences emerge that have historically preceded major turning points. This comprehensive guide walks through calculation approaches, reviews multi-cycle historical patterns, demonstrates how to layer SOPR and MVRV for validation, and supplies concrete monitoring routines using free dashboards so you can apply these signals in live trading environments.
What Is Realized Price and How to Calculate It
Realized price is computed by dividing Bitcoin’s realized capitalization—the total value of all unspent transaction outputs weighted by their last movement price—by the current circulating supply. This metric moves far more slowly than spot price because it only updates when coins actually transact, creating a stable baseline that reflects holder behavior rather than speculative noise. To perform the calculation yourself, export UTXO sets from a public blockchain explorer, sum the realized values, and divide by total supply. In practice, most analysts rely on pre-built dashboards that refresh daily. Understanding this lag is essential: a widening gap between market price and realized price indicates either euphoria or capitulation, depending on direction, and sets the stage for mean-reversion trades.
Historical Reversal Patterns Across Cycles
Reviewing prior Bitcoin cycles reveals repeatable divergence signatures. During the 2013 bull market, market price exceeded realized price by more than 300 percent before a prolonged correction began. The 2017 peak showed a similar extreme divergence that aligned with the cycle top within weeks. In 2021, multiple intermediate divergences appeared; each time SOPR and volume confirmed the signal, reversals followed within days. Bear-market bottoms, such as late 2018 and 2022, featured market price trading well below realized price, often accompanied by prolonged negative divergences that marked capitulation. These patterns persist because realized price reflects actual holder cost basis while market price reacts instantly to macro news and leverage unwinds. Traders who wait for divergence magnitude to exceed 20–30 percent and then seek secondary confirmation have historically captured higher-probability entries and exits.
Integrating SOPR and MVRV for Stronger Confirmation
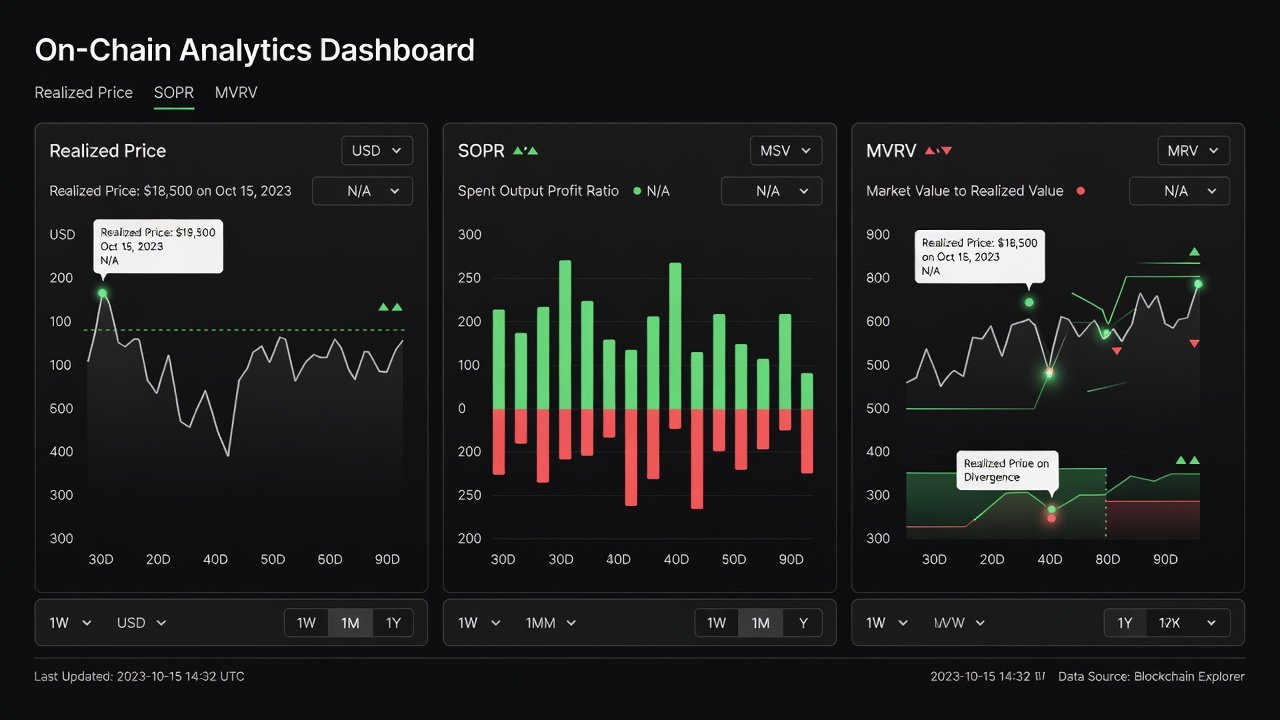
Single-metric signals carry false-positive risk, so layering SOPR and MVRV improves accuracy. SOPR measures whether spent outputs were in profit or loss; readings above 1 during positive realized-price divergences strengthen sell signals, while readings below 1 during negative divergences reinforce buy zones. MVRV compares market capitalization to realized capitalization and provides a normalized view of over- or undervaluation. When a large positive realized-price divergence coincides with MVRV above 3.5 and SOPR spiking, historical analogs point to distribution phases. Conversely, negative divergences paired with MVRV below 1 and SOPR near 0.85 have preceded strong accumulation periods. Combining these three metrics creates a confluence checklist that filters out noise from short-term volatility and macro shocks.
Step-by-Step Monitoring with Free On-Chain Dashboards
Establish a repeatable daily workflow using publicly available platforms. Begin at Glassnode by loading the realized price chart and enabling the market-price overlay. Set percentage-deviation alerts at the 20 percent and 35 percent thresholds. Next, open the SOPR and MVRV panels on the same workspace and align timeframes to daily or weekly. Supplement with Mempool.space to observe mempool congestion and fee spikes that often accompany divergence extremes. Cross-check network fundamentals on Bitcoin.org for protocol updates that could influence holder behavior. Export weekly readings into a spreadsheet and annotate any macro events that coincide with spikes. Review the dashboard at the same hour each day to maintain consistency and reduce emotional decision-making.
Actionable Entry and Exit Examples
Consider a scenario in early 2026 where market price trades 32 percent above realized price, SOPR reaches 1.8, and MVRV exceeds 4.0. Historical parallels suggest preparing exit orders or tightening trailing stops rather than adding long exposure. A contrasting case occurs when market price falls 28 percent below realized price, SOPR drops to 0.82, and MVRV approaches 0.9; experienced traders have used these conditions to scale into positions with stop-losses placed just below the prior cycle low. Always define position size first—risking no more than 1–2 percent of capital per trade—and require at least two of the three metrics to align before executing. Document each trade with screenshots of the dashboard to refine future decision thresholds.
Common Trader Mistakes to Avoid
- Acting on divergence magnitude alone without waiting for SOPR or MVRV confirmation, which frequently produces premature entries during macro-driven spikes.
- Using default dashboard settings that lag by several hours instead of refreshing data or enabling real-time alerts.
- Ignoring exchange-specific realized price variations that appear during high-volume liquidation cascades.
- Overlooking the slow-moving nature of realized price and expecting instant mean reversion within hours rather than days or weeks.
- Failing to adjust position sizing when divergences occur alongside major macroeconomic announcements that temporarily distort market price.
Building a Practical Daily Workflow
Integrate realized price monitoring into a broader routine that includes risk management and journal keeping. Start each session by checking overnight divergence changes, then review open positions against current SOPR and MVRV readings. Update a simple trade log noting entry rationale, confirmation metrics, and planned exit levels. Weekly, back-test recent signals against prior cycle analogs to calibrate thresholds. This structured approach converts theoretical knowledge into repeatable execution and helps traders maintain discipline during volatile 2026 conditions.
FAQ: Interpreting Spikes During Macro Events
How do macro announcements affect realized price divergences?
Interest-rate decisions or geopolitical developments can drive rapid market-price moves while realized price remains anchored, producing temporary spikes. Always require secondary confirmation from SOPR or volume before treating the divergence as a tradable signal.
Are divergences reliable during black-swan events?
They supply useful context about holder cost basis but should never serve as the sole decision trigger. Combine them with broader portfolio risk limits and liquidity considerations.
What timeframes work best for these signals?
Daily and weekly charts effectively filter intraday noise; shorter timeframes generate frequent false positives that erode performance over time.
Can realized price divergences be used for altcoin trading?
Similar metrics exist for major altcoins, yet Bitcoin’s deeper liquidity and longer history make its divergences more statistically robust; apply altcoin versions only after confirming Bitcoin market structure.
By embedding realized price divergence analysis into a disciplined, multi-metric workflow, traders gain clearer visibility into 2026 market cycles and reduce reliance on emotion-driven decisions.
No comments yet. Be the first!