 CryptoChain Blog
Introduction to Bitcoin Funding Rates and On-Chain Analysis
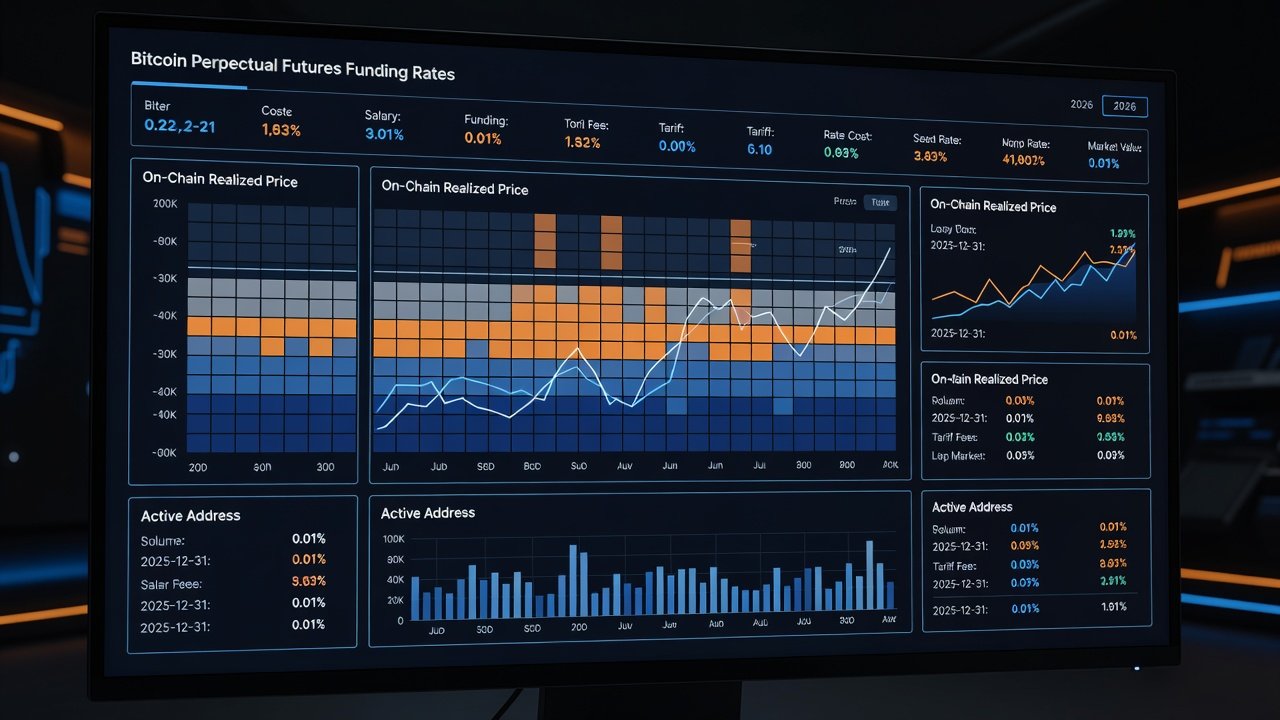
Bitcoin traders in 2026 increasingly rely on the interplay between perpetual futures funding rates and on-chain metrics to identify high-probability reversal setups. Funding rates reflect the cost of holding leveraged positions in perpetual contracts, while on-chain data such as realized price and active addresses provide fundamental context about network health and investor behavior. When these signals diverge, they often precede major price movements. Intermediate analysts who master this combination gain a meaningful edge over those who rely on derivatives data alone or on-chain indicators in isolation. This integrated approach helps filter false signals that frequently appear during periods of high leverage or low network participation.
This article explores the mechanics behind funding rate calculations in detail, key divergence patterns confirmed by on-chain data, and real-world examples from 2024-2025. Readers will also find a practical monitoring workflow using free tools alongside Glassnode alerts, complete with multiple entry and exit examples plus risk management considerations.
Mechanics of Funding Rate Calculation
Perpetual futures contracts never expire, so exchanges use funding rates to keep the contract price aligned with the spot price. The funding rate is typically calculated every eight hours and consists of a premium index component plus a fixed interest rate. The premium index measures how far the perpetual contract trades from the spot price, while the interest rate is usually a small constant that favors shorts slightly in neutral conditions. Positive rates indicate longs pay shorts, while negative rates mean shorts pay longs. Understanding the exact formula helps traders anticipate when rates are likely to flip. Most major exchanges publish their funding rate methodology openly, allowing analysts to backtest historical extremes effectively.
Traders monitor extreme funding levels because they signal overcrowded positions. Sustained positive funding above 0.05% per eight-hour period often coincides with local tops, especially when confirmed by weakening on-chain activity. Conversely, deeply negative rates can mark capitulation points where leveraged shorts become exhausted. These extremes rarely occur in isolation; they usually develop over several days as momentum builds in one direction.
Key On-Chain Metrics for Confirmation
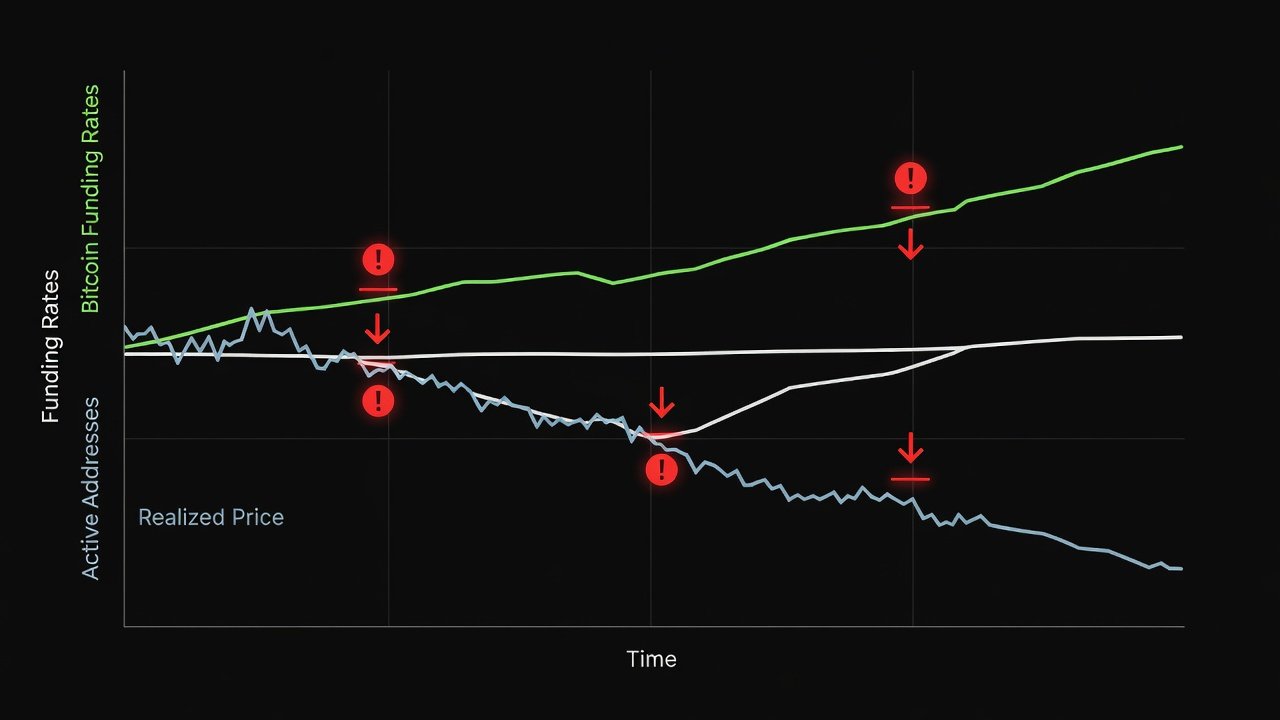
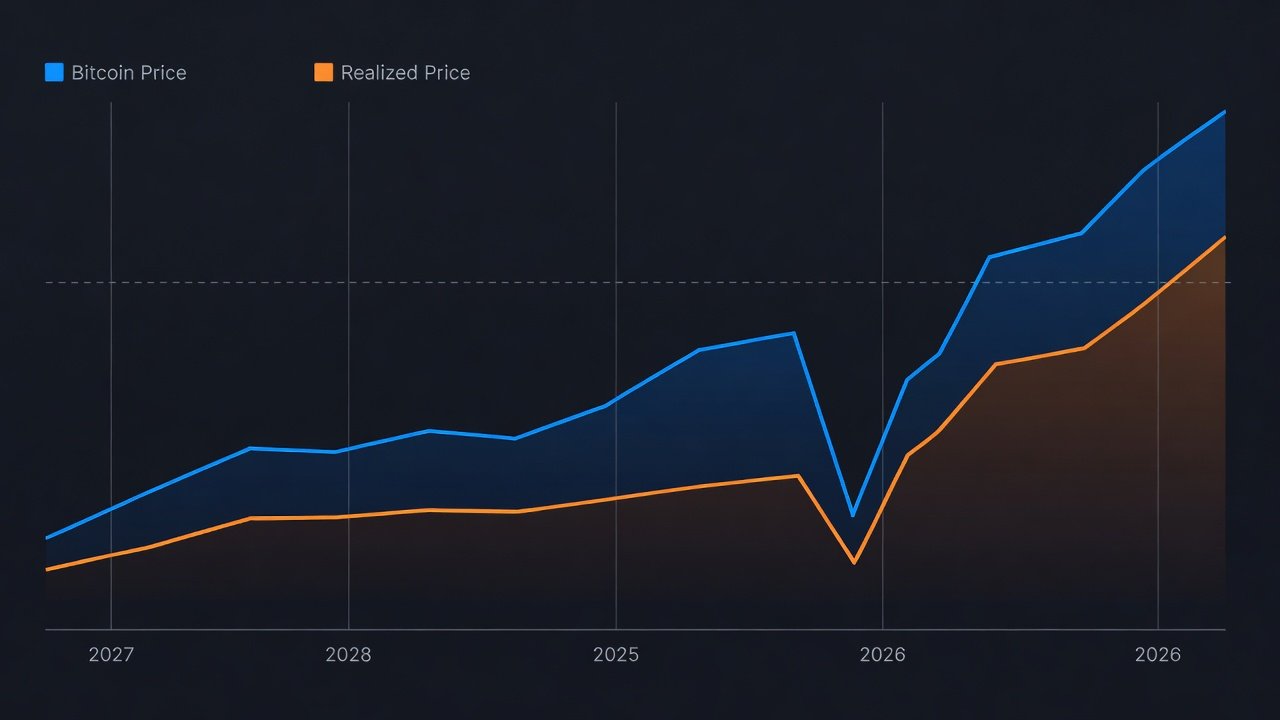
Realized price represents the average acquisition cost of all coins moved on-chain, serving as a dynamic support or resistance level. When Bitcoin trades well above realized price alongside elevated funding rates, the setup becomes ripe for mean-reversion trades. This metric smooths out volatility by focusing on actual transaction prices rather than last traded prices. Active addresses measure daily unique participants and serve as a proxy for network engagement. Declining active addresses while funding remains positive creates a classic bearish divergence. Conversely, rising active addresses during negative funding often marks accumulation zones where new users and returning holders increase participation.
Additional context comes from related indicators such as the ratio of realized price to market price, which highlights overvaluation periods. When this ratio expands rapidly alongside positive funding, the probability of a reversal increases. Monitoring these metrics together provides a more complete picture than any single data point.
Divergence Patterns with On-Chain Confirmation
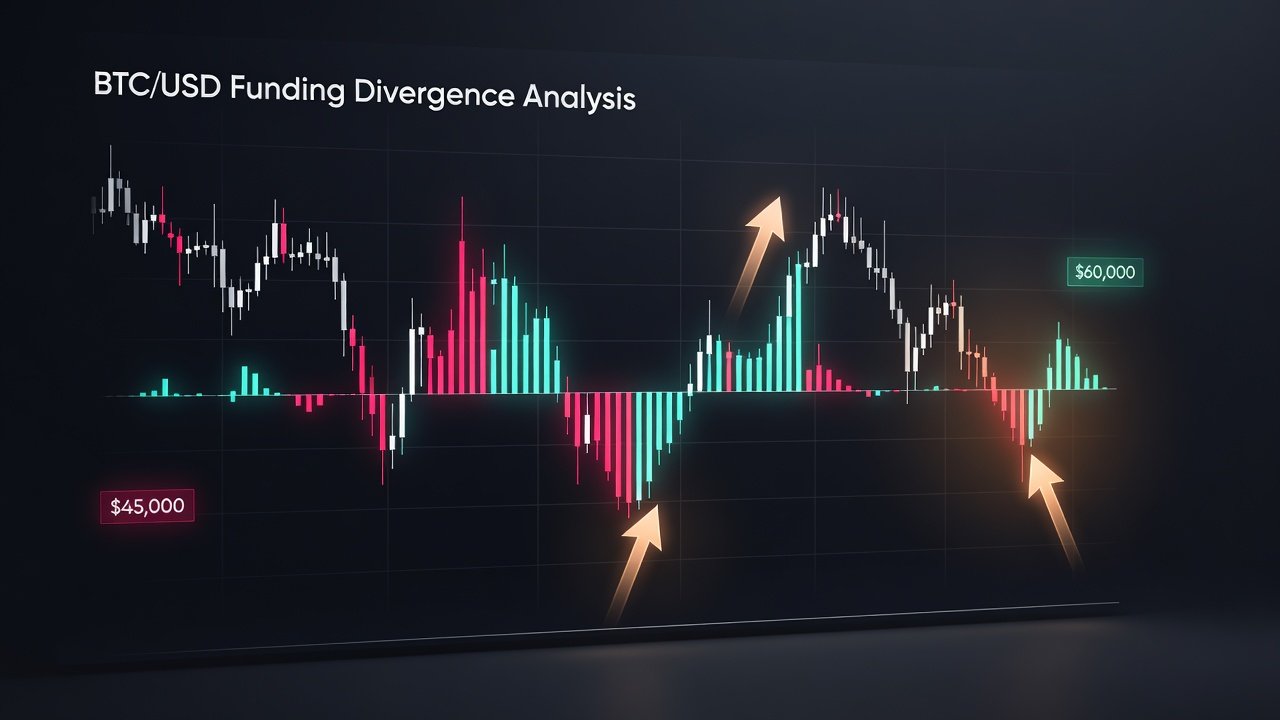
The most reliable setups occur when funding rates reach extremes but on-chain metrics fail to confirm the move. For instance, a spike in funding accompanied by falling active addresses and price above realized price frequently precedes corrections. Bullish divergences appear when funding turns deeply negative yet realized price holds as support and active addresses begin rising. These patterns have shown consistency across multiple market cycles because they capture both sentiment extremes in derivatives markets and fundamental shifts in network usage.
Historical Case Studies from 2024-2025
In March 2024, funding rates climbed above 0.08% while active addresses plateaued and price sat 35% above realized price. The subsequent 18% correction validated the divergence signal and offered clear short opportunities for traders who waited for on-chain confirmation. A similar pattern emerged in late 2025 when negative funding coincided with recovering active addresses near realized price, leading to a strong rally into year-end. Another notable episode occurred in mid-2025 when repeated positive funding spikes without corresponding active address growth preceded two separate pullbacks of over 12% each. These cases highlight how combining both data types filters out noise from pure derivatives signals and improves timing accuracy.
Step-by-Step Monitoring Workflow
- Set up free alerts on Glassnode for realized price and active address changes, configuring thresholds that match your trading timeframe.
- Track funding rates via exchange APIs or dashboards from major perpetual venues such as those documented on bitcoin.org resources.
- Cross-reference daily: flag when funding exceeds 0.05% or drops below -0.03% and note the duration of the extreme.
- Confirm with on-chain: check if active addresses trend opposite to funding direction over at least three days.
- Validate against realized price distance for additional context and review historical analogs before acting.
- Document each signal in a trading journal to refine future decision-making.
Practical Entry and Exit Examples
Consider a scenario where funding reaches +0.06% and active addresses drop 12% week-over-week while price trades 28% above realized price. An intermediate trader might enter a short position with a stop above the recent high and target the realized price level. Exit occurs when funding normalizes and active addresses stabilize, locking in gains before sentiment shifts again. In another example, deeply negative funding combined with active address recovery near realized price offers attractive risk-reward entries for longs, with stops placed below realized price to protect against further downside. A third setup involves gradual funding normalization paired with steadily rising active addresses, signaling a low-risk accumulation phase where position sizing can be increased incrementally.
Risk Management and Common Pitfalls
Even strong divergences require strict risk controls. Position sizes should remain modest until multiple confirmations align, and traders must avoid chasing signals without stops. Common mistakes include ignoring the duration of funding extremes, failing to account for weekend gaps in on-chain data, and over-relying on a single metric without cross-checking others. Maintaining a checklist that includes funding level, active address trend, and realized price distance reduces emotional decision-making during volatile periods.
FAQ: Common Trader Mistakes
Why do traders ignore on-chain confirmation?
Many focus solely on derivatives data and miss weakening fundamentals, leading to premature entries and larger drawdowns.
How often should alerts be reviewed?
Daily checks suffice for most intermediate analysts; intraday noise can obscure the longer-term divergences that matter most for swing and position trades.
Can these signals work in ranging markets?
They perform best at extremes; in low-volatility ranges, funding and on-chain metrics often remain neutral, requiring patience until a clear divergence develops.
What timeframes work best for this approach?
Daily and weekly charts provide the clearest signals, though four-hour data can be used for fine-tuning entries once the higher-timeframe divergence is confirmed.
Are there seasonal factors to consider?
Funding rates tend to spike during strong trending periods regardless of season, but holiday liquidity reductions can exaggerate extremes and should be factored into position sizing.
Conclusion
Integrating funding rate extremes with on-chain metrics like realized price and active addresses gives Bitcoin traders a clearer edge for 2026 reversal predictions. By following the outlined workflow, studying historical cases, and avoiding common pitfalls, analysts can build more robust trading decisions grounded in both market sentiment and network fundamentals. Consistent application of these combined signals supports disciplined execution across varying market conditions.
No comments yet. Be the first!