 CryptoChain Blog

Introduction to On-Chain Metrics for Bitcoin Forecasting
Bitcoin's price volatility makes traditional analysis insufficient. Enter on-chain metrics: data from the blockchain revealing investor behavior, network health, and market cycles. Metrics like Network Value to Transactions (NVT) ratio, Spent Output Profit Ratio (SOPR), and whale accumulation offer predictive power for trends, especially eyeing 2026's potential bull run post-halving.
This guide dives deep into these advanced indicators, provides step-by-step instructions on using Glassnode and Dune Analytics, shares real-world examples from recent news, and delivers actionable insights for volatile markets.
Key On-Chain Metrics Explained
NVT Ratio: Bitcoin's Price-to-Earnings Equivalent
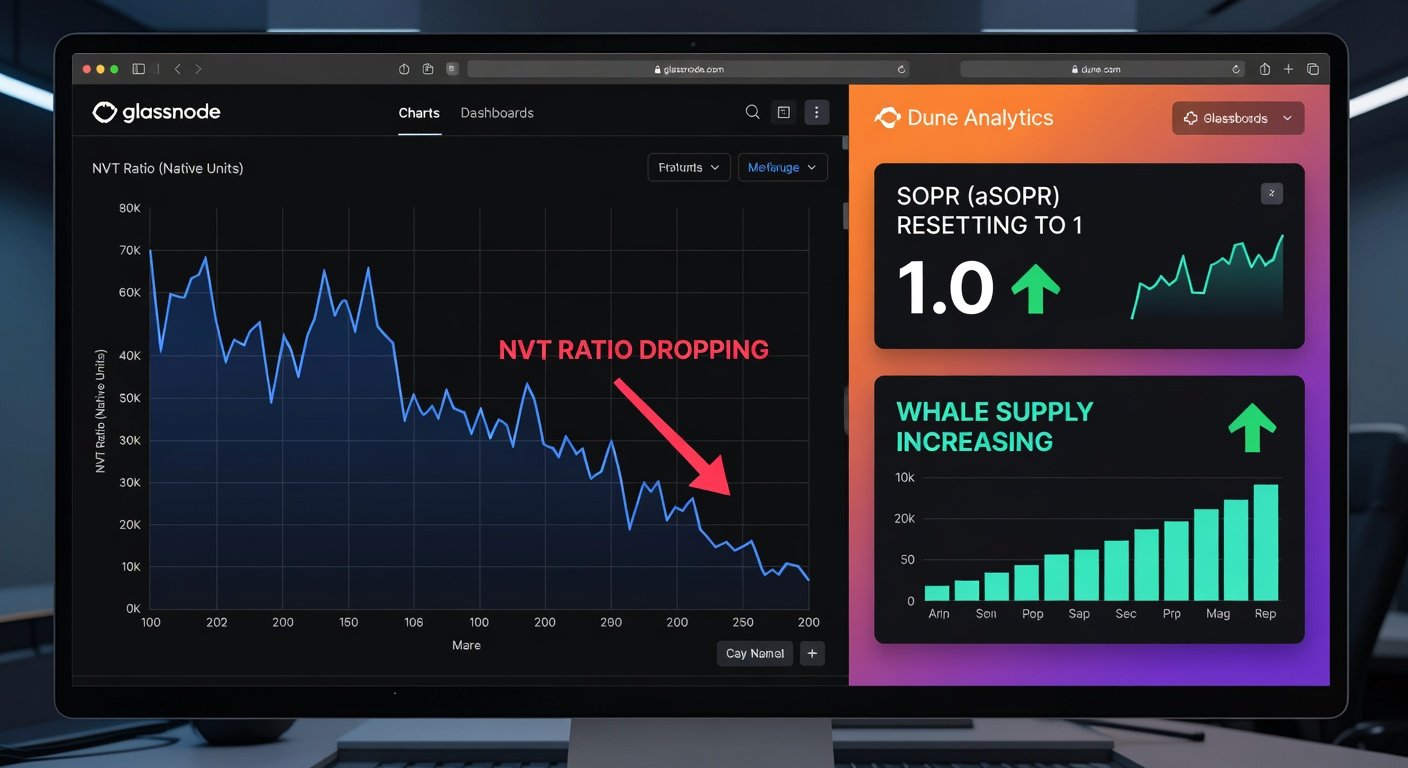
The NVT ratio compares Bitcoin's market cap to its on-chain transaction volume, akin to a stock's P/E ratio. A high NVT suggests overvaluation (like a bubble), while low NVT indicates undervaluation.
- Formula: Market Cap / Daily Transaction Volume
- Thresholds: Above 100 = overheated; below 50 = buy zone.
In 2021's bull run, NVT spiked above 150 before the crash, signaling tops.
SOPR: Gauging Profit-Taking and Holder Sentiment
SOPR measures the profit ratio of spent outputs. Values >1 mean sellers profit; <1 indicate losses (capitulation). Resetting to 1 shows accumulation phases.
- Real-world signal: SOPR dipping below 1 in March 2020 preceded a massive rally.
Whale Accumulation: Tracking Big Players
Whales (holders of 1,000+ BTC) drive trends. Metrics track their net position change. Rising accumulation during dips forecasts reversals.
Step-by-Step: Analyzing with Glassnode
- Sign Up: Visit Glassnode and create a free account for basic charts; upgrade for advanced metrics.
- NVT Setup: Search "NVT Ratio" in Studio. Toggle to Golden Cross (NVT Signal) for buy/sell crosses.
- SOPR Analysis: Go to "SOPR" metric. Use daily/weekly views; watch for resets below 1.
- Whale Watch: Select "Supply Distribution" or "Whale Supply". Positive delta = accumulation.
- Export & Alert: Set custom alerts for thresholds, e.g., NVT < 60.
Glassnode Example: 2024 ETF Impact
In January 2024, U.S. Bitcoin ETFs launched. Glassnode showed whale accumulation surging 20% amid dips, with SOPR resetting—predicting the rally to $73K. NVT cooled from 120 to 80, confirming undervaluation.
Step-by-Step: Dune Analytics for Custom Queries
Dune Analytics lets you query Bitcoin data via SQL for free.
- Dashboard Hunt: Search "Bitcoin NVT" or "SOPR Dune" for community dashboards.
- Create Custom: Fork a query. Example for whale accumulation: SELECT date, sum(delta) FROM bitcoin.transactions WHERE entity = 'whale' GROUP BY date.
- Visualize: Add charts for SOPR trends or NVT overlays with price.
- Fork Popular: Use @hagaetc's BTC dashboards for SOPR variants.
Dune Example: Post-Halving 2024
April 2024 halving saw Dune queries reveal SOPR <0.98 (capitulation), followed by whale buys. This mirrored 2020, forecasting a cycle peak in late 2025.
Forecasting Bitcoin Trends for 2026
Current Signals (Mid-2024)
NVT at ~90 suggests room to run. SOPR steady above 1 shows HODLing. Whales added 500K BTC YTD per Glassnode—bullish for 2025 halving cycle extension into 2026.
- Bull Case: NVT drops to 40, whales hoard 1M+ BTC → $200K+ BTC.
- Bear Case: SOPR >1.05 sustained + whale distribution → Correction to $40K.
Layer 2 growth (e.g., Lightning) may inflate transaction volume, lowering NVT—watch adjusted variants.
Actionable Insights for Volatile Markets
1. Combine Metrics: Enter longs when NVT <70 AND SOPR reset AND whale +delta.
2. Risk Management: Scale in on capitulation (SOPR <0.97); trail stops on NVT spikes.
3. Portfolio Allocation: 20-30% BTC during accumulation; reduce on euphoria.
4. Tools Stack: Glassnode daily, Dune weekly, pair with macro (Fed rates).
| Metric | Bull Signal | Bear Signal |
|---|---|---|
| NVT | <60 | >120 |
| SOPR | Reset to 1 | >1.05 persistent |
| Whales | Net + | Net - |
Recent News Tie-Ins
MicroStrategy's 2024 buys (whale-like) boosted accumulation metrics, per Glassnode. Mt. Gox repayments in July tested SOPR—resilience confirmed strength. German gov sales caused temporary whale distribution, but quick recovery signals HODLers dominate.
Conclusion: Empower Your BTC Strategy
Mastering NVT, SOPR, and whale metrics via Glassnode and Dune transforms guesswork into data-driven foresight. For 2026, accumulation trends point to new highs amid adoption. Start tracking today—your edge in crypto volatility awaits.


No comments yet. Be the first!