 CryptoChain Blog

Introduction to Decentralized Mobility Tokenomics
Decentralized mobility projects combine blockchain technology with transportation networks, enabling peer-to-peer ride-sharing, vehicle data marketplaces, and autonomous fleet coordination. In 2026, evaluating these projects requires robust onchain analytics to assess token economics beyond surface-level metrics. This guide provides practical techniques for analyzing transaction velocity, holder distribution, staking incentives, and cross-chain flows using real-world data approaches. Readers will gain step-by-step methods to evaluate emerging protocols in vehicle networks and ride-sharing ecosystems. Onchain data offers transparency that traditional finance lacks, revealing how tokens circulate, incentivize participation, and sustain long-term value. As mobility protocols mature, analysts must distinguish between genuine network activity and artificial inflation of metrics, ensuring evaluations reflect sustainable economics rather than short-term hype.
Understanding Transaction Velocity Tracking
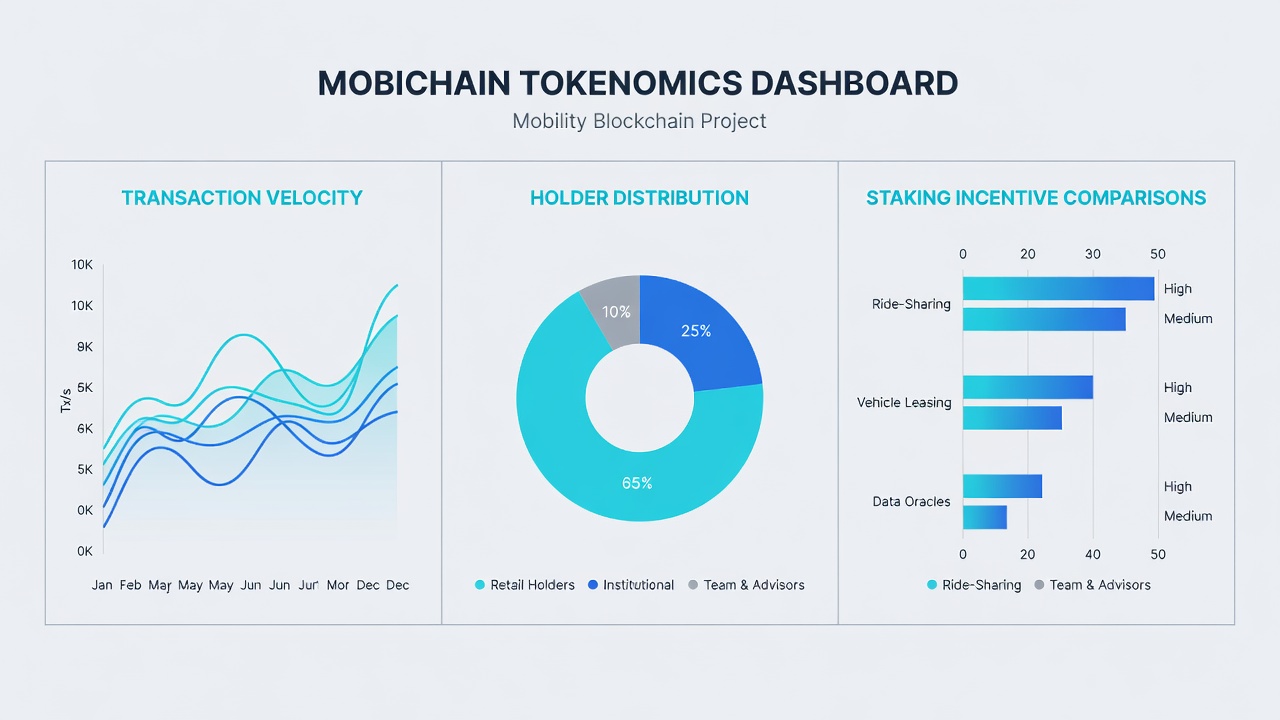
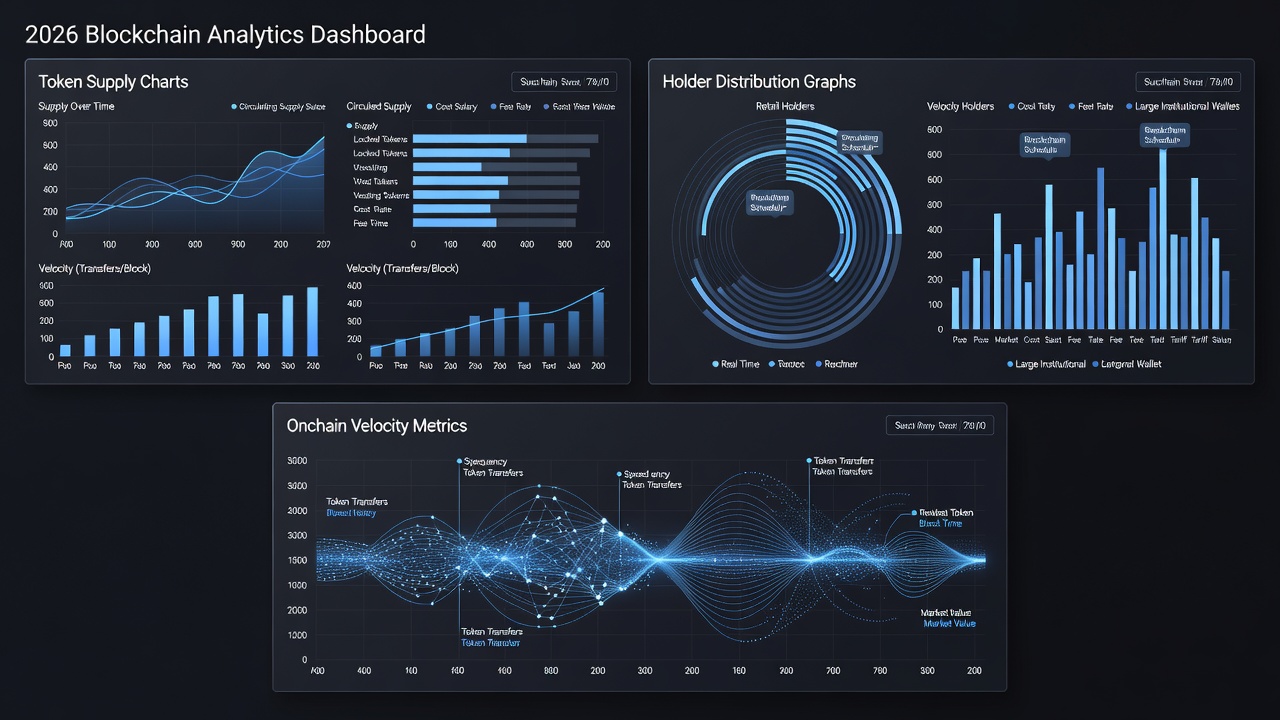
Transaction velocity measures how frequently a token changes hands within a network. High velocity can indicate strong utility but may also signal speculative trading. For mobility projects, velocity often correlates with ride completions or data-sharing events. To track velocity in 2026, analysts pull data from blockchain explorers and aggregate platforms. Calculate velocity as total transaction volume divided by average token supply over a period. Focus on mobility-specific smart contract interactions, such as payments for rides or sensor data uploads. Example analysis from a sample ride-sharing protocol shows daily active wallets interacting with payment contracts, where velocity spikes during peak commuting hours help identify organic usage versus wash trading. Advanced tracking includes segmenting velocity by transaction type, such as driver payouts versus rider fees, to uncover usage patterns. Tools like public RPC endpoints allow real-time queries, enabling analysts to build dashboards that flag anomalies when velocity deviates from historical baselines by more than 30 percent.
Analyzing Holder Distribution Patterns
Holder distribution reveals token concentration risks. Healthy projects show broad distribution among users, drivers, and validators rather than concentrated whale holdings. Use onchain tools to segment holders by wallet size and activity. Look for patterns like gradual accumulation by network participants or sudden dumps from early investors. In mobility tokenomics, driver and rider wallets often represent the most valuable distribution tier because they directly contribute to protocol utility. Practical steps include querying token contract events to map distribution over time and comparing Gini coefficients calculated from onchain balances against benchmarks from established DeFi protocols. Further depth comes from clustering analysis that groups wallets by behavioral signals, such as repeated interactions with mobility smart contracts. This approach highlights whether tokens are held by active ecosystem participants or speculative entities, informing risk assessments for long-term viability.
Evaluating Staking Incentives and Models
Staking mechanisms in mobility projects reward long-term holders who secure the network or provide liquidity for vehicle-related services. Compare models by examining lock-up periods, reward rates, and slashing conditions. Common incentive structures include fixed APY for node operators and dynamic rewards tied to ride volume. Analysts should review contract code for sustainability, ensuring rewards do not outpace network revenue. Comparison of models shows one approach ties staking yields directly to protocol fees from ride transactions, promoting alignment, while another uses inflationary rewards that may dilute value if adoption stalls. Review historical onchain staking participation rates to gauge effectiveness. Additional considerations involve examining penalty mechanisms for poor performance, such as node downtime in fleet coordination, and how these affect overall token supply dynamics. Cross-referencing staking data with mobility usage metrics, like completed trips per staked token, provides a clearer picture of incentive alignment.
Ethereum.org documentation provides foundational insights into staking contract design applicable to mobility chains.
Monitoring Cross-Chain Token Flows
Mobility networks often operate across multiple blockchains for scalability. Monitoring flows involves tracking bridge transactions and wrapped token activity. Key metrics include inflow/outflow volumes and retention rates post-bridge. High cross-chain activity can signal expanding user bases in different regions. Step-by-step example starts with bridge contract events, aggregates daily volumes, then correlates with mobility usage data like vehicle registrations on secondary chains. Watch for anomalies such as rapid outflows indicating reduced trust. Analysts should also monitor liquidity pool depths on destination chains to assess whether bridged tokens remain active in the mobility ecosystem or quickly exit. Integrating data from multiple explorers helps validate flow integrity and detect potential bridge exploits or congestion issues that could impact user experience in ride-sharing applications.
Step-by-Step Onchain Analysis Workflow
- Identify core contracts for payments, staking, and data oracles by reviewing project documentation and verified source code on block explorers.
- Extract transaction logs using public APIs over a 30-day window, filtering for mobility-specific events such as ride initiations and data uploads.
- Calculate velocity and distribution metrics while applying filters to exclude known exchange wallets and focus on user-driven activity.
- Compare staking participation against total supply, including analysis of reward distribution fairness across different holder cohorts.
- Map cross-chain movements and validate against off-chain mobility indicators like regional vehicle counts or trip volumes reported by the protocol.
- Document findings in a repeatable report format that includes visualizations of trends and recommended thresholds for healthy metrics.
This workflow helps avoid common pitfalls like ignoring contract upgrades that alter token mechanics. Expanding the process with automated scripts can reduce manual effort while increasing consistency across multiple project evaluations.
Common Pitfalls in Onchain Token Evaluations
- Over-relying on total value locked without examining actual usage velocity, which can mask dormant capital in mobility protocols.
- Ignoring wallet clustering that masks concentrated control by a small number of entities influencing governance decisions.
- Failing to account for bridge risks in cross-chain setups, including potential delays or fees that affect real-time ride payment settlements.
- Misinterpreting staking rewards without revenue context, leading to overestimation of sustainability in inflationary models.
- Neglecting to verify oracle data integrity, which is critical for accurate vehicle sensor inputs in decentralized transport networks.
Frequently Asked Questions
How often should analysts refresh onchain data for mobility projects?
Daily monitoring of key metrics is ideal, with deeper weekly reviews to capture velocity trends and distribution shifts accurately. Monthly audits help identify longer-term structural changes in token circulation.
What distinguishes sustainable staking models from unsustainable ones?
Sustainable models link rewards to verifiable network activity such as completed rides, whereas unsustainable ones rely solely on new token issuance without usage growth. Reviewing emission schedules against actual protocol revenue provides clear differentiation.
Can cross-chain flows indicate project health?
Yes, consistent inflows paired with rising onchain activity typically signal expanding adoption across regions and chains. Sudden spikes in outflows without corresponding usage increases warrant closer investigation into potential issues.
How do analysts handle data from multiple blockchains in mobility ecosystems?
They aggregate normalized metrics across chains using standardized query templates and cross-reference with protocol-specific dashboards to ensure comprehensive coverage without duplication of events.
Conclusion
Effective onchain analytics in 2026 empowers investors and builders to assess decentralized mobility tokenomics with precision. By mastering velocity tracking, distribution analysis, incentive evaluation, and flow monitoring, stakeholders can make informed decisions in this evolving sector. Apply these techniques consistently to identify resilient projects that deliver real utility in vehicle networks and ride-sharing protocols. Continued refinement of these methods will support the growth of trustworthy decentralized transportation systems worldwide.

No comments yet. Be the first!