 CryptoChain Blog
Introduction to Building a Tokenomics Dashboard
Tokenomics dashboards empower analysts and developers to monitor the economic health of blockchain tokens in real time. By leveraging onchain analytics, users can track critical factors such as token supply dynamics, holder concentration, and transaction flows without relying on centralized reports. This approach provides transparency and enables proactive responses to market changes. In this comprehensive guide, we walk through the entire process of creating a custom dashboard, from selecting data providers to deploying live visualizations. Whether you are analyzing a new DeFi token or optimizing an existing project, these steps deliver actionable insights backed by verifiable blockchain data.
Understanding Tokenomics Fundamentals and Onchain Data
Tokenomics encompasses the design and behavior of a token's economy, including issuance schedules, utility mechanisms, and incentive structures. Onchain analytics extracts this information directly from public ledgers, offering an unfiltered view. For instance, examining smart contract events can reveal minting patterns or burn mechanisms. Developers benefit from this data by identifying imbalances early, such as excessive centralization among a few wallets. Integrating these elements into a dashboard transforms raw data into digestible metrics that support strategic decisions across multiple networks like Ethereum, Solana, and Polygon.
Choosing Reliable Data Sources for Onchain Analytics
Selecting the right data sources forms the foundation of any effective dashboard. Begin by evaluating providers based on coverage, query speed, and ease of integration. Dune Analytics stands out for its SQL interface that allows custom queries across historical data. Flipside Crypto provides pre-built dashboards and API endpoints tailored for token metrics. Additional options include direct node access via providers like Alchemy or Infura for raw blockchain reads. Always verify data freshness and chain support before committing. Test small queries first to confirm accuracy, and consider redundancy by combining two sources to mitigate downtime risks. This layered approach ensures your dashboard remains robust even during network congestion.
Integrating Core Tokenomics Indicators
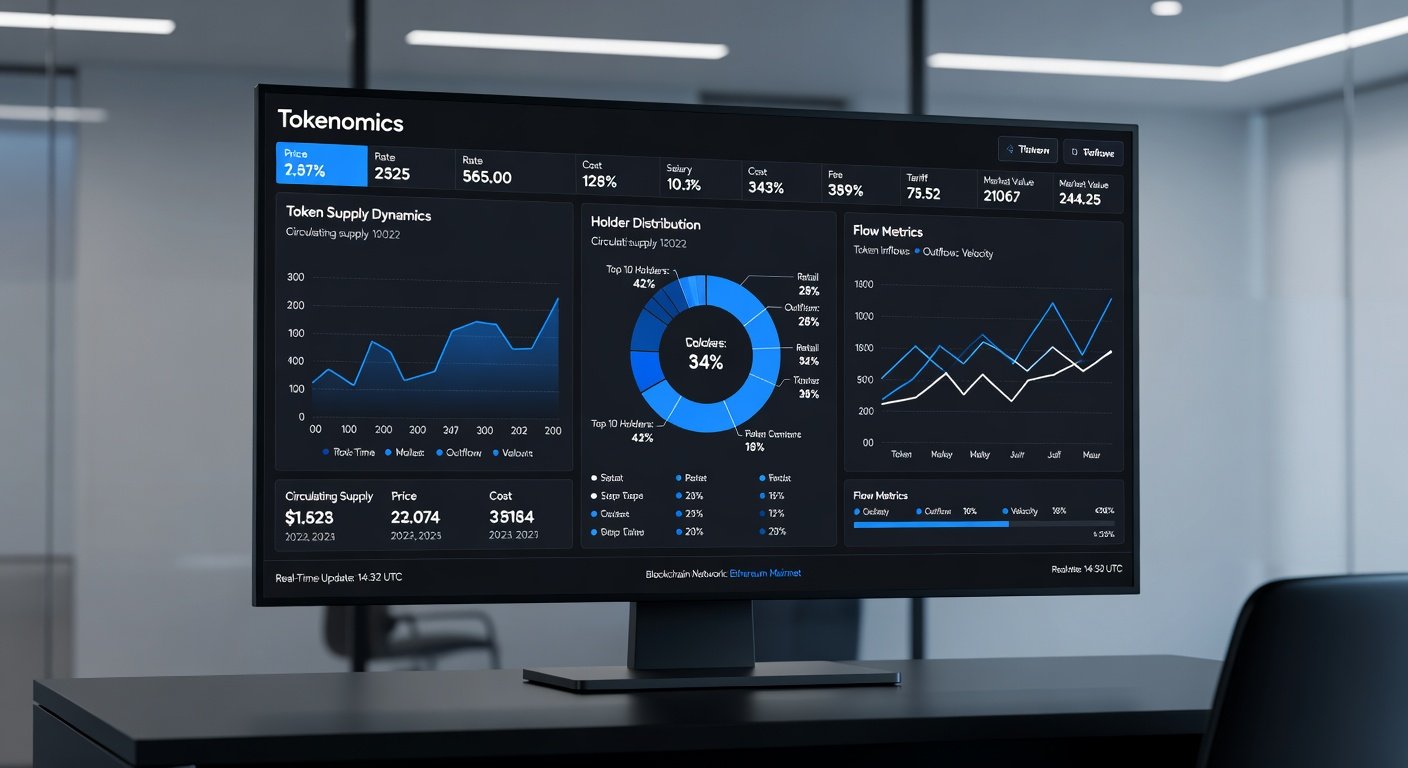
Focus on a core set of indicators that capture supply flows and holder distribution. Start with circulating supply by querying the token contract's totalSupply function adjusted for locked or burned amounts. Next, track holder distribution through balance queries on top addresses, calculating Gini coefficients to measure concentration. Velocity metrics, derived from transaction volume divided by supply, highlight usage intensity. Implement these via scheduled API calls or event listeners. For example, set up alerts when a single wallet accumulates over 5% of supply, signaling potential manipulation risks. Use libraries such as Web3.js or ethers.js in your backend to fetch and process this data continuously.
Step-by-Step Setup and Implementation Guide
Follow these practical steps to assemble your dashboard. First, create a backend service using Node.js or Python to poll data sources every few minutes. Store results in a lightweight database like PostgreSQL for historical analysis. Second, define data models that normalize metrics across chains. Third, implement error handling for failed queries, such as retry logic with exponential backoff. Fourth, add authentication layers if sharing the dashboard internally. This methodical build prevents common pitfalls like data silos and ensures scalability as you add more tokens.
Setting Up Visualizations for Real-Time Insights
Effective visualizations turn complex metrics into intuitive displays. Employ tools like Chart.js for interactive line graphs showing supply over time or D3.js for custom network graphs of token flows. Configure real-time updates using WebSockets to reflect live blockchain events. Include filters for time ranges and token subsets to enhance usability. 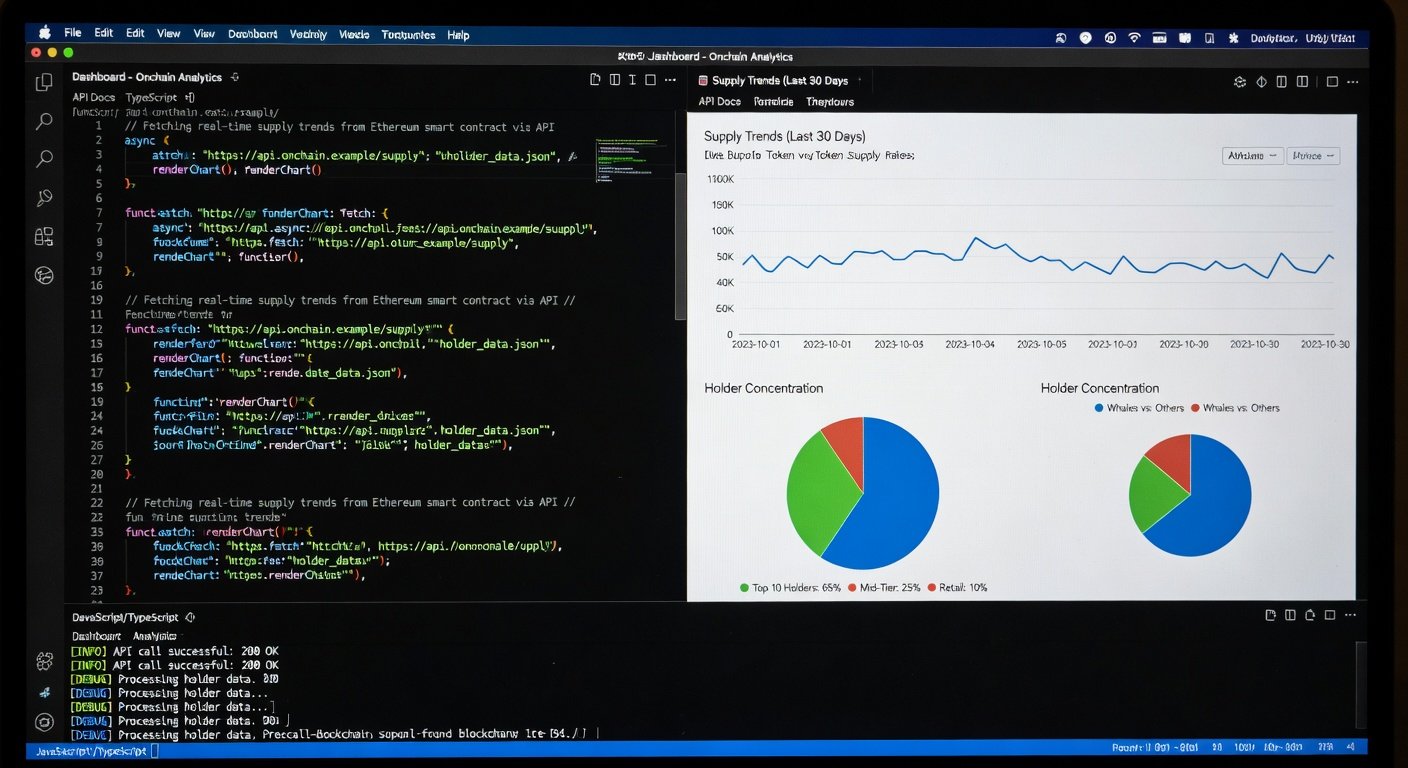
Testing the Dashboard on Live Networks
Validate your implementation rigorously on testnets before mainnet deployment. Simulate token transfers and burns to confirm metric calculations match expectations. Compare outputs against public explorers such as Etherscan for spot checks. Monitor for discrepancies caused by reorgs or pending transactions. Once stable, run the dashboard on live networks with a small set of tokens, gradually expanding scope. Document any anomalies and refine query logic accordingly to maintain high data fidelity.
Comparing Popular Analytics Platforms
Dune Analytics offers unmatched flexibility for bespoke queries but requires SQL proficiency. Flipside Crypto simplifies onboarding with ready-made templates yet may limit deep customization. Nansen provides advanced wallet labeling for behavioral insights, though at higher complexity. Evaluate each against your team's technical skills and monitoring frequency. Hybrid setups combining free tiers of multiple platforms often yield the best balance of features and reliability.
Common Mistakes to Avoid
Many builders overlook data normalization across chains, leading to inconsistent metrics. Another frequent error involves ignoring smart contract upgrades that alter token logic. Always version your queries and maintain fallback sources. Avoid overcomplicating the interface; prioritize clarity over flashy elements that obscure key signals.
Conclusion
Constructing a tokenomics dashboard with onchain analytics delivers ongoing visibility into token economies. By following the outlined steps for data integration, visualization, and testing, analysts and developers gain a powerful monitoring tool. Continue iterating based on user feedback and emerging blockchain developments to keep the solution relevant.
Frequently Asked Questions
- How do I ensure data accuracy in my dashboard? Cross-verify outputs from multiple independent sources and implement automated consistency checks at regular intervals.
- What cost considerations arise when scaling queries? Focus on efficient query design and caching strategies to manage usage without unnecessary overhead.
- How can I scale the dashboard for monitoring multiple tokens? Modularize your codebase with reusable components and leverage database indexing for faster retrieval across portfolios.
- What tools help with real-time data streaming? Combine GraphQL subscriptions with blockchain event filters for seamless live updates.

No comments yet. Be the first!