 CryptoChain Blog
Introduction to Onchain Tokenomics for Price Prediction
In the volatile crypto markets of 2026, traders and analysts increasingly rely on onchain tokenomics signals to forecast token prices. These metrics derived directly from blockchain data provide transparent insights into supply dynamics, demand patterns, and network health that traditional offchain analysis often misses. This guide delivers actionable strategies to collect, analyze, and model these signals for more informed predictions.
Key Onchain Tokenomics Indicators
Understanding core indicators forms the foundation of accurate forecasting. Token velocity measures how frequently tokens change hands, signaling usage versus speculation. Supply inflation tracks new token issuance rates that can dilute value. Holder concentration reveals distribution risks through whale dominance. Transaction flows highlight capital movement between wallets and exchanges.
Token Velocity and Its Predictive Power
High velocity often indicates strong utility but can pressure prices downward if not matched by demand growth. Analysts monitor velocity trends to distinguish between healthy circulation and panic selling.
Supply Inflation Patterns
Emerging L2 tokens in 2026 frequently adjust emission schedules. Monitoring inflation curves helps identify when supply shocks may occur.
Holder Concentration Metrics
Concentrated holdings in few addresses increase volatility risks, while broad distribution supports stability.
Transaction Flow Analysis
Tracking inflows to exchanges versus DeFi protocols reveals accumulation or distribution phases.
Step-by-Step Process for Data Collection and Analysis
- Access onchain data platforms such as Dune Analytics for custom queries on token metrics.
- Use Arkham Intelligence to label wallets and trace flows in real time.
- Export datasets covering velocity, inflation, concentration, and flows over multiple timeframes.
- Build simple regression models or use visualization tools to correlate signals with historical price movements.
- Validate predictions against live network activity before executing trades.
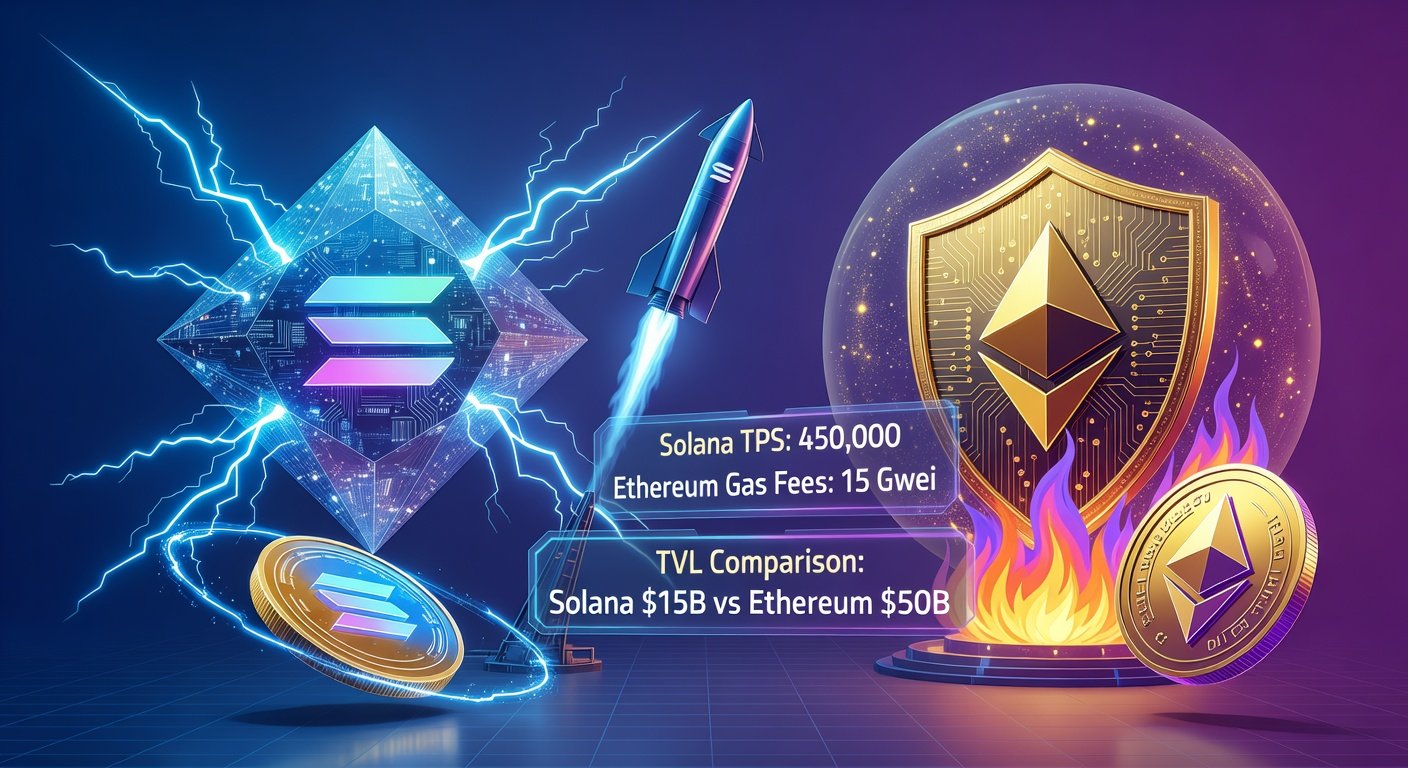
Practical Examples from 2026 High-Performing L2 Tokens
Consider emerging Layer-2 tokens that showed strong bullish signals through declining velocity paired with low inflation and dispersed holders. In contrast, bearish patterns emerged when transaction flows spiked toward centralized exchanges alongside rising concentration. These real-world cases illustrate how combining multiple indicators improves accuracy over single-metric approaches.
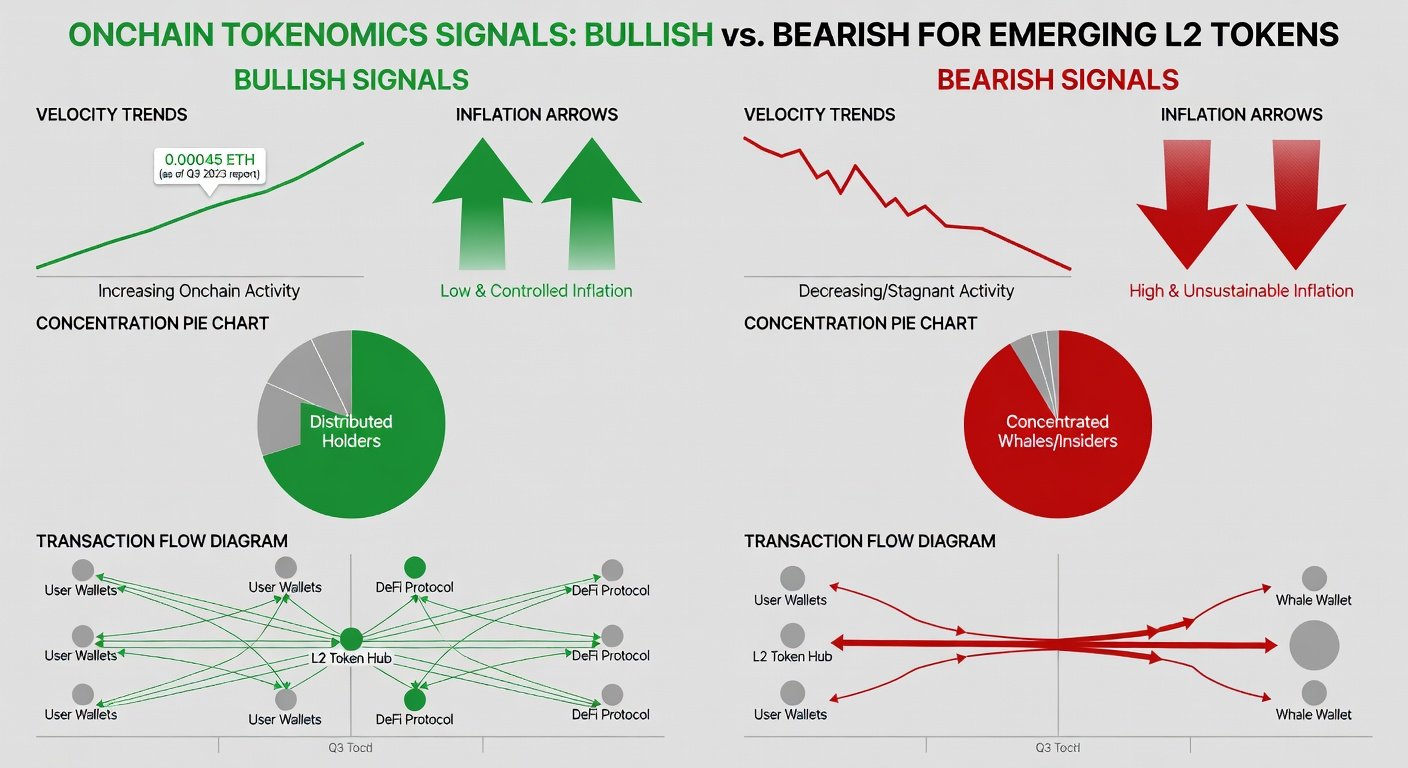
Bullish Versus Bearish Signal Patterns Comparison
- Bullish: Decreasing velocity with rising active addresses, stable low inflation, and balanced flows into staking pools.
- Bearish: Surging velocity, high inflation rates, top-10 holder dominance exceeding 60%, and heavy exchange inflows.
Integrating Onchain Insights with Offchain Factors
Robust predictions combine onchain data with macroeconomic trends, regulatory updates, and sentiment analysis. This hybrid approach mitigates blind spots inherent in purely blockchain-derived models.
Frequently Asked Questions
What are common pitfalls when using onchain signals?
Over-reliance on single metrics or ignoring data lags can lead to false signals. Always cross-verify across multiple sources.
How do I integrate tools like Dune and Arkham effectively?
Start with pre-built dashboards, then create custom queries tailored to specific tokens for deeper insights.
Should tokenomics signals be combined with offchain data?
Yes, pairing onchain metrics with traditional market indicators delivers the most reliable forecasts in 2026's complex environment.
Conclusion
By systematically applying onchain tokenomics signals, crypto participants can gain a decisive edge in price prediction. Consistent practice with the outlined steps and tools transforms raw blockchain data into strategic advantage.

No comments yet. Be the first!