 CryptoChain Blog
Introduction to Bitcoin Derivatives Metrics in 2026
Bitcoin trading in 2026 demands more than sentiment analysis. Derivatives data such as funding rates, options open interest, and perpetual swap volumes provide objective signals that help traders anticipate price movements during periods of heightened volatility and evolving regulations. This guide shows how to interpret these metrics and integrate them into practical decision-making frameworks that go far beyond basic chart reading.
Traders who combine derivatives insights with spot market analysis often achieve more consistent results. Understanding the search intent behind these signals allows you to move beyond reactive trading and build strategies supported by measurable data. In an environment where regulatory announcements can shift overnight, having a clear process for evaluating leveraged positioning becomes essential for risk management and opportunity identification.
Key Derivatives Metrics Explained
Futures Funding Rates
Funding rates indicate the cost of holding long or short positions in perpetual contracts. Positive rates typically signal bullish sentiment as longs pay shorts, while negative rates suggest bearish pressure. In 2026, monitoring rate spikes can reveal overcrowding in one direction before major reversals occur. Traders should track both the absolute level and the rate of change over multiple timeframes to distinguish between temporary noise and structural shifts in market positioning.
Options Open Interest
Open interest tracks the total number of outstanding options contracts. Rising open interest near key strike prices often highlights levels of expected support or resistance. Large clusters of call or put open interest can act as magnets for price action during expiration weeks. Examining the distribution across strikes and expirations helps identify where institutional players are placing their bets and where liquidity may thin out quickly.
Perpetual Swap Volumes
Volume data from perpetual swaps reveals real-time market participation. Sudden volume surges accompanied by funding rate divergence frequently precede breakouts or breakdowns. Comparing these volumes against spot exchange activity helps distinguish between organic moves and leveraged-driven volatility. Volume profiles also allow traders to gauge the conviction behind a trend, especially when combined with open interest changes that show whether new positions are being opened or closed.
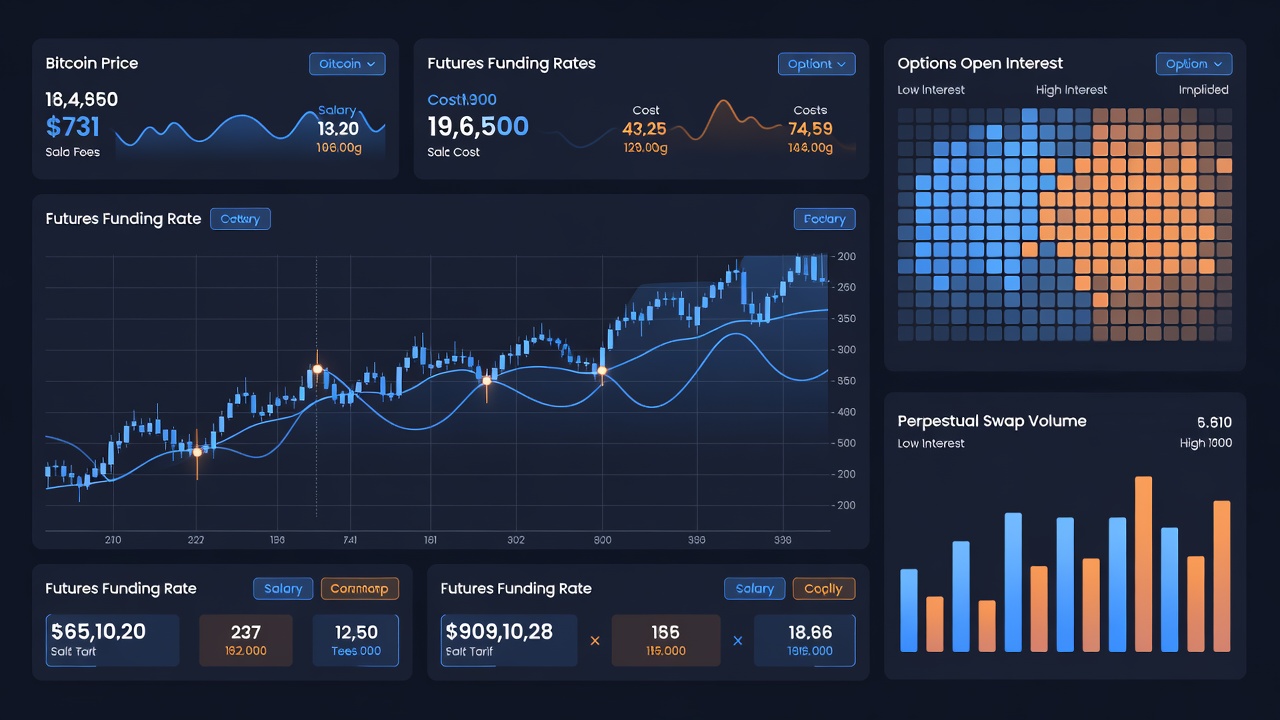
Step-by-Step Setup of a Derivatives Dashboard
Building an effective dashboard requires reliable data sources and clear visualization. Follow these steps to create your own monitoring system that covers multiple exchanges and time horizons:
- Select data providers that aggregate funding rates and open interest across major exchanges while ensuring API reliability during high-volatility periods.
- Configure charts to display 24-hour and 7-day funding rate averages alongside Bitcoin spot price with customizable alert thresholds.
- Add heatmaps for options open interest by strike and expiration, including filters for call versus put ratios.
- Incorporate volume overlays for perpetual contracts with alerts for unusual spikes exceeding historical norms.
- Include a correlation panel comparing derivatives metrics to on-chain indicators such as exchange reserves and active addresses.
- Test the dashboard with historical replay tools to validate signal accuracy across different market regimes.
Regularly review dashboard accuracy by backtesting against historical events from early 2026 and adjust parameters as market structure evolves.
Real-World Examples from Recent BTC Events
During the March 2026 volatility spike, funding rates on major perpetual contracts reached extreme positive levels three days before a sharp correction. Traders who noticed the divergence between rising open interest in out-of-the-money calls and declining spot volumes avoided significant drawdowns by reducing leverage ahead of the move.
In another instance, clustered options open interest at key strikes acted as strong resistance during the May regulatory announcement period. Price repeatedly tested these levels before breaking lower when funding rates flipped negative, demonstrating how open interest can serve as a leading indicator of exhaustion.
A third example occurred in late April when perpetual swap volumes surged without corresponding spot accumulation. This mismatch warned attentive traders that the rally lacked underlying conviction and was largely driven by leveraged positioning that later unwound rapidly.

Spot vs Derivatives-Driven Insights: A Comparison
Spot market analysis focuses on actual ownership and exchange flows. Derivatives data, by contrast, highlights leveraged positioning and expected future volatility. When both align, conviction increases. Divergence often signals caution, as seen when high perpetual volumes failed to support spot accumulation in April 2026.
Key differences include:
- Spot data reflects long-term holder behavior; derivatives metrics capture short-term speculative flows that can reverse quickly.
- Derivatives can amplify moves through leverage, creating false breakouts not visible in spot charts alone.
- Regulatory shifts tend to impact derivatives markets first due to institutional participation and margin requirements.
- Combining both data types provides a fuller picture of supply and demand dynamics across different participant groups.
Common Pitfalls to Avoid
Many traders misinterpret funding rate extremes without context. Always cross-reference with open interest trends and volume patterns before making decisions. Another frequent error is ignoring exchange-specific differences; some platforms report volumes differently, leading to skewed conclusions if only one source is used. Finally, avoid over-reliance on a single metric—combine at least three derivatives signals before acting and maintain a trading journal to track performance over time.
Actionable Checklist for Daily Analysis
- Check funding rate direction and magnitude at market open and compare to the previous week.
- Review options open interest heatmap for large clusters near current price and note any unusual put-call imbalances.
- Compare 24-hour perpetual volume to the 7-day average and flag significant deviations.
- Note any regulatory news that could affect derivatives trading rules or margin requirements.
- Document observations in a trading journal for pattern recognition and strategy refinement.
- Reassess dashboard alerts and adjust thresholds if market volatility increases.
Integrating Derivatives Tools with Broader Bitcoin Insights
Derivatives metrics become most powerful when layered with on-chain data, macroeconomic indicators, and sentiment analysis. For instance, pairing rising open interest with declining exchange reserves can confirm accumulation by long-term holders. During regulatory uncertainty, monitoring funding rate flips alongside official statements helps separate noise from material developments. This multi-layered approach reduces false signals and supports more robust position sizing decisions.
FAQ: Integrating Derivatives Tools with Bitcoin Insights
How do beginners start using funding rates?
Begin by observing rates over a two-week period alongside price action. Note correlations before applying them to live trades and start with small position sizes while learning the nuances.
Are options open interest data reliable across all exchanges?
Major platforms provide transparent data, but always verify aggregation methods from multiple sources for consistency and account for differences in reporting standards.
Can these metrics replace fundamental analysis?
No. Derivatives signals work best when combined with on-chain metrics, macroeconomic factors, and regulatory awareness to form a complete trading thesis.
What timeframes work best for monitoring perpetual swap volumes?
Daily and weekly timeframes offer the clearest signals for swing trading, while intraday volume spikes are useful for short-term scalping strategies during news events.
How should traders adjust for changing regulatory environments?
Stay informed through official channels and reduce leverage when new rules are announced, as margin requirements and product availability can shift rapidly.
For additional regulatory context, consult official resources such as the U.S. Securities and Exchange Commission and the Commodity Futures Trading Commission. Authoritative market overviews are also available from Bitcoin.org.
Conclusion
Mastering Bitcoin derivatives data transforms trading from reactive to proactive. By systematically tracking funding rates, open interest, and swap volumes, traders position themselves to navigate 2026 market conditions with greater confidence and discipline while avoiding common emotional pitfalls.


No comments yet. Be the first!