 CryptoChain Blog

Introduction to Bitcoin Hash Rate in 2026
The Bitcoin hash rate remains one of the most reliable on-chain metrics for assessing network security and anticipating price shifts. In 2026, as the network matures post-halving cycles, traders increasingly rely on hash rate trends to time entries and exits. This forward-looking analysis examines how hash rate fluctuations reveal miner behavior, difficulty adjustments, and potential capitulation events without overlapping derivatives or covered on-chain data.
Hash rate measures the total computational power securing the Bitcoin blockchain. Higher values indicate robust miner participation and stronger network resilience, while sharp drops can signal stress in the mining ecosystem that often precedes price volatility. Understanding these dynamics allows traders to move beyond surface-level price charts and incorporate fundamental network health indicators into their decision-making process.
Understanding Hash Rate Fundamentals
Hash rate is expressed in exahashes per second (EH/s) and represents the aggregate work performed by miners solving cryptographic puzzles. As Bitcoin's adoption grows in 2026, institutional miners contribute larger shares, making hash rate less volatile yet more predictive of sustained trends. The metric evolves constantly as new hardware comes online and older equipment is retired.
Key Components of Hash Rate Data
- Daily averages from multiple pools provide a smoothed view of activity and reduce the impact of single-pool reporting errors.
- Seven-day and 30-day moving averages filter out noise from temporary outages, weather disruptions, or maintenance windows.
- Regional distribution highlights geographic risks such as energy policy changes or regulatory shifts in major mining hubs.
- Pool concentration data shows how much hash power is controlled by the largest operators, which can affect network decentralization perceptions.
These elements help traders distinguish between healthy growth driven by technological upgrades and warning signs of economic pressure on the mining sector.
Hash Rate as a Leading Indicator for Price
Historical patterns show hash rate often leads price by weeks or months. Rising hash rate typically reflects miner confidence in future profitability, which can support upward price pressure. Conversely, declining hash rate may foreshadow reduced selling pressure once weaker miners exit the network. In 2026, with improved efficiency in mining hardware, this correlation strengthens because only profitable operations persist, creating clearer signals for market participants who monitor the data consistently.
Traders who integrate hash rate analysis into their workflows gain an edge by identifying periods when network fundamentals diverge from short-term price action, often providing early clues about trend sustainability.
Interpreting Hash Rate Fluctuations
Short-term dips of 5-10% are common due to maintenance or weather events and rarely warrant immediate trading action. Sustained declines beyond 15% over multiple weeks warrant closer attention because they may indicate structural changes in miner economics. Traders should monitor the rate of change rather than absolute levels alone, paying special attention to how quickly the hash rate recovers after a dip.
Context matters greatly: a drop during a bull market may indicate temporary consolidation ahead of new hardware deployments, while the same movement in a bear phase could accelerate capitulation and create buying opportunities once the network stabilizes. Real-world examples from previous years demonstrate that rapid recoveries often coincide with improved sentiment and subsequent price appreciation.
Correlation with Difficulty Adjustments
Bitcoin's difficulty adjusts every 2016 blocks, roughly every two weeks, to maintain consistent block times. Hash rate directly influences these adjustments. When hash rate rises, difficulty increases, raising the bar for all miners and potentially squeezing out less efficient operations. This feedback loop creates predictable cycles that informed traders can anticipate and prepare for.
Step-by-step process for analysis: First, track current hash rate against the prior difficulty epoch using public dashboards. Second, project the next adjustment based on recent seven-day trends and estimate the percentage change. Third, evaluate how the projected adjustment may impact marginal miners' profitability and whether it is likely to trigger further exits. Fourth, observe the actual adjustment and compare it to your projection to refine future forecasts. This methodical approach turns raw data into actionable intelligence.
Identifying Miner Capitulation Signals
Capitulation occurs when unprofitable miners shut down operations, causing a noticeable hash rate drop. Key signals include accelerated declines coinciding with low transaction fees, prolonged periods below key moving averages, and sudden reductions in active mining pools. Additional indicators involve monitoring the speed of hash rate recovery after difficulty adjustments, as slower recoveries often point to deeper structural issues within the mining community.
Recognizing these moments allows traders to prepare for potential rebounds as the network self-corrects through difficulty reductions, restoring profitability for remaining participants and often preceding broader market recoveries.
Practical Steps Using Free Dashboards
Access real-time data through public explorers without requiring paid subscriptions. Begin by visiting bitcoin.org for foundational network stats and educational resources. Next, navigate to trusted explorers and set alerts for hash rate thresholds that match your risk tolerance. Compare 7-day and 30-day averages daily while noting any divergences from difficulty trends. Cross-reference with historical charts to identify similar setups from prior cycles. Finally, log observations over at least three epochs to build pattern recognition and improve your interpretive skills over time.
This repeatable method provides actionable insights and helps traders develop a consistent monitoring routine that integrates seamlessly with other analysis tools.
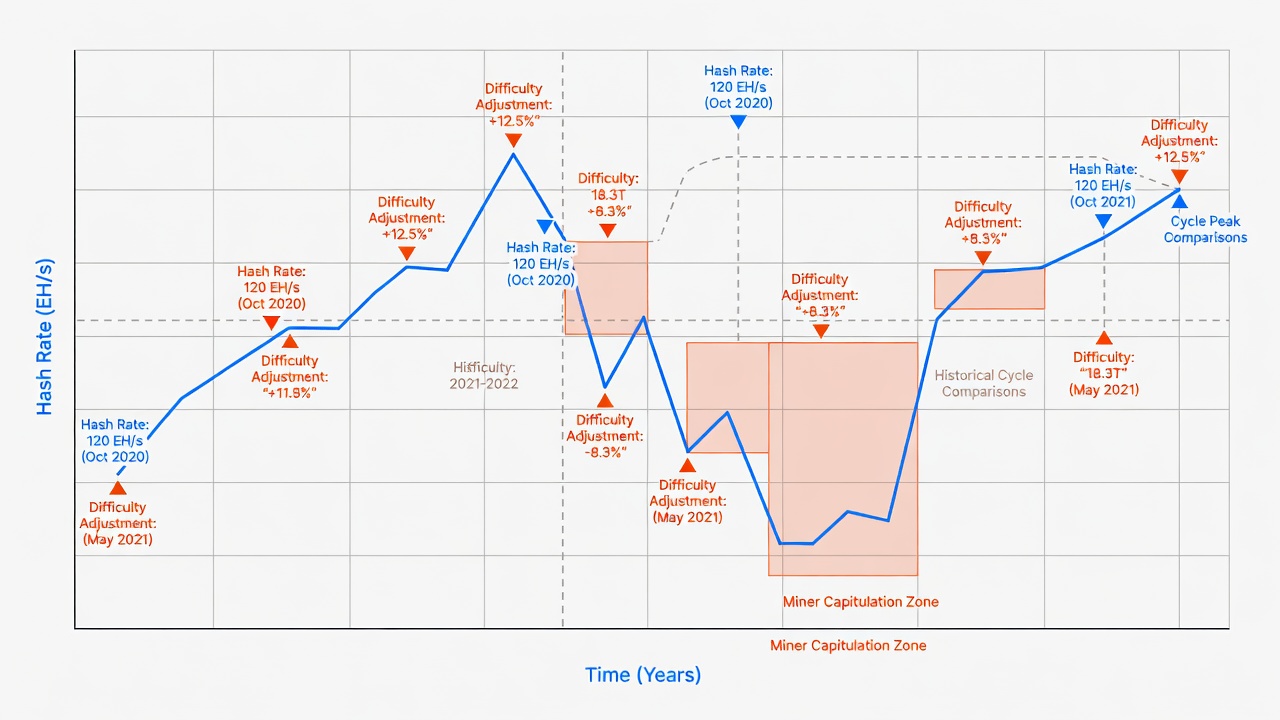
Comparisons to Past Market Cycles
Reviewing 2016-2017 and 2020-2021 cycles reveals recurring hash rate behaviors that remain relevant in 2026. Post-halving periods often feature initial hash rate dips followed by steady climbs as efficiency gains offset reward reductions. The 2024 halving effects carried into 2026 demonstrate similar resilience, with hash rate recovering faster due to advanced ASIC technology and larger-scale operations. In each cycle, the speed of recovery after the first difficulty adjustment served as a reliable gauge of long-term network strength.
Traders can apply these lessons by focusing on recovery speed rather than peak values alone and by noting how institutional participation has reduced the magnitude of drawdowns compared to earlier eras. Understanding these historical parallels helps contextualize current readings and avoid overreacting to normal cyclical movements.
Building a Personal Hash Rate Monitoring Routine
Establishing a daily or weekly review process enhances the value of hash rate data. Start each session by checking the latest 24-hour average and comparing it to the previous week. Next, review the upcoming difficulty adjustment estimate and note any pool-level anomalies. Maintain a simple spreadsheet to track changes across multiple timeframes and flag any readings that fall outside your predefined tolerance bands. Over several months, this routine builds intuition and helps surface actionable patterns before they become obvious in price charts.
Common Misconceptions Addressed in FAQ
Does higher hash rate always mean higher prices?
Not immediately. While correlated over time, external factors like macroeconomic events or regulatory announcements can override short-term relationships and create temporary disconnects.
Are all hash rate drops negative?
No. Seasonal or regional dips often resolve quickly and may even strengthen the network by removing inefficient participants, leading to a healthier overall ecosystem.
Can retail traders accurately predict using hash rate alone?
Hash rate serves best as one tool within a broader framework, combined with volume analysis, sentiment indicators, and macroeconomic context for more reliable outcomes.
How frequently should hash rate be checked?
Daily checks are sufficient for most traders, with deeper weekly reviews to identify emerging trends and avoid noise from short-term fluctuations.
Is hash rate data manipulated by large pools?
While individual pools report their own figures, aggregated data from multiple independent sources provides a reliable consensus view that is difficult to distort significantly over sustained periods.
Conclusion
Bitcoin hash rate trends in 2026 offer traders a powerful lens into network health and forthcoming price dynamics. By mastering fluctuation interpretation, difficulty correlations, and capitulation detection through free tools, market participants gain a practical edge. Consistent monitoring of these metrics, combined with historical context and disciplined routines, supports more informed decisions across evolving market cycles and helps navigate both opportunities and risks effectively.
No comments yet. Be the first!