 CryptoChain Blog
Introduction to the Bitcoin Fear & Greed Index in 2026
The Bitcoin Fear & Greed Index remains one of the most practical sentiment tools for traders navigating volatile crypto markets. In 2026, as Bitcoin continues to mature as an asset class with growing institutional involvement, understanding how this index reflects market psychology can help time entries and exits more effectively than ever before. This comprehensive guide explores its components in detail, reliable data sources, historical patterns with BTC price action, and actionable strategies tailored for current conditions. Traders who master these elements gain a clear edge in identifying emotional extremes that often precede major price reversals.
Understanding the Index Components
The index aggregates multiple factors to produce a score from 0 (extreme fear) to 100 (extreme greed). Key inputs include volatility measured through standard deviation of returns, market momentum and volume derived from trading activity, social media sentiment analyzed via natural language processing on platforms like X and Reddit, investor surveys from participating crypto communities, Bitcoin dominance as a ratio of BTC market cap to total crypto market cap, and Google Trends data tracking search interest in Bitcoin-related terms. Each component receives weighted scoring that adjusts dynamically based on prevailing conditions, providing a holistic view of investor emotion rather than isolated metrics. Volatility often carries significant weight during periods of sharp price swings, while social sentiment can amplify readings in response to viral news events.
Real-Time Data Sources for 2026
Traders access the index through established platforms that update daily without requiring paid subscriptions. Primary sources include alternative.me for the core calculation and CoinDesk for complementary market data and context. Additional reliable feeds come from on-chain analytics providers that publish daily updates. Cross-referencing these ensures accuracy when making 2026 trading decisions, especially during high-volatility periods around halving cycles or regulatory announcements from major economies. Setting up automated alerts on these platforms allows traders to react promptly to shifts in the index reading.
Historical Correlation Patterns with BTC Price Action
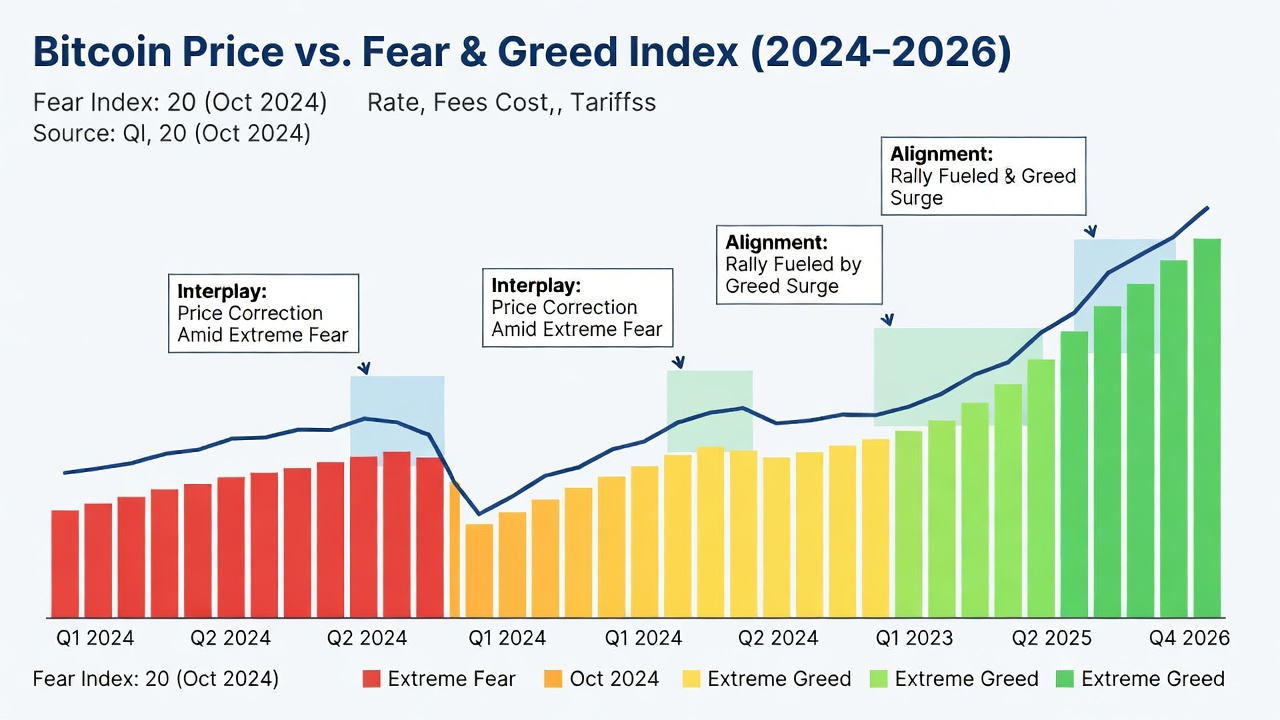
Analysis of past cycles shows the index often reaches extreme fear readings near local bottoms and extreme greed near tops. In 2024–2025 data, prolonged fear periods below 25 frequently preceded rebounds of substantial magnitude within weeks. Conversely, greed readings above 75 aligned with subsequent corrections as profit-taking intensified. These patterns hold relevance for 2026 as institutional participation grows and retail sentiment remains a leading contrarian indicator. Examining multi-year charts reveals that the index tends to lag price by a few days during rapid moves but provides strong confirmation when divergences appear between sentiment and actual price action.
Step-by-Step Interpretation Methods
Effective use begins with consistent daily monitoring. First, check the daily index value and note its 7-day and 30-day moving averages for context to filter out short-term noise. Second, compare the current reading against Bitcoin’s recent price trend to identify divergences that may signal upcoming reversals. Third, assess individual components, such as whether volatility or social volume is driving the score, allowing traders to understand the underlying drivers. Fourth, map the reading to historical zones: 0–24 (strong buy zone with high conviction), 25–49 (cautionary accumulation area), 50–74 (neutral territory requiring additional confirmation), 75–100 (sell zone with elevated risk of pullbacks). Fifth, validate with broader market events before executing trades to avoid acting on isolated sentiment spikes.
Combining the Index with On-Chain Metrics
Pairing the Fear & Greed Index with on-chain indicators like exchange reserves, active addresses, realized price, and long-term holder supply enhances signal reliability substantially. For example, extreme fear coinciding with declining exchange balances and rising active addresses often signals accumulation phases by strong hands. In 2026 examples, traders who layered these metrics avoided false signals during brief sentiment spikes caused by news events such as ETF approvals or macroeconomic data releases. Building a simple dashboard that overlays index readings with these metrics provides a more robust decision framework than sentiment alone.
Common Pitfalls Traders Encounter
- Over-relying on the index without confirming price structure or volume, leading to premature entries during trending markets.
- Ignoring component breakdowns that reveal temporary distortions from social media noise or survey response biases.
- Applying the tool in isolation during low-liquidity weekends when readings can swing wildly without fundamental backing.
- Failing to account for macro factors like interest rate decisions or geopolitical events that override pure sentiment signals.
- Chasing every extreme reading instead of waiting for confluence with technical levels and on-chain data.
Comparison with Other Sentiment Tools
| Tool | Strengths | Limitations | Best Use Case |
|---|---|---|---|
| Fear & Greed Index | Simple daily score, broad inputs covering multiple dimensions | Lagging during rapid news events and occasional component weighting changes | Contrarian timing across multiple timeframes |
| Social Volume Metrics | Real-time narrative shifts and emerging themes | High noise from bots and coordinated campaigns | Short-term scalping and narrative trading |
| On-Chain Dashboards | Fundamental holder behavior and supply dynamics | Requires technical knowledge and interpretation skills | Long-term positioning and accumulation zones |
| Funding Rate Analysis | Direct insight into leveraged positioning | Can be manipulated in low-volume periods | Detecting over-leveraged conditions |
2026 Trading Examples and Practical Application
Consider a scenario in early 2026 where the index drops to 18 amid regulatory uncertainty in key jurisdictions. Combined with rising long-term holder supply and falling exchange reserves, this setup historically preceded multi-week rallies. Traders following the step-by-step method entered positions gradually while setting alerts for index reversals above 40 as profit-taking signals. Another example involved a mid-year greed spike above 80 during a period of strong ETF inflows; those who combined this with elevated funding rates successfully reduced exposure ahead of a 15% correction. These cases illustrate how the index serves best as a timing overlay rather than a standalone predictor.
Building a 2026 Trading Plan Using the Index
Start by defining clear risk parameters and position sizing rules before incorporating sentiment data. Integrate the index into a weekly review process that also reviews on-chain flows and technical support levels. Test historical backtesting scenarios specific to 2025–2026 market regimes to calibrate personal thresholds. Maintain a trading journal documenting index readings at entry and exit points to refine the approach over time. This disciplined structure helps transform raw sentiment readings into consistent trading outcomes.
FAQ
How reliable are the signals in 2026?
Signals remain reliable when used as one layer within a multi-indicator framework rather than standalone triggers, especially as market maturity increases institutional influence on price discovery.
Does the index work during bull and bear markets?
Yes, but thresholds may shift slightly; extreme readings still mark emotional extremes regardless of the broader cycle, though bull markets tend to sustain higher average readings.
Can beginners use this tool effectively?
Beginners benefit most by starting with the basic interpretation steps and gradually adding on-chain confirmation before scaling position sizes.
What timeframes work best with the index?
Daily and weekly readings provide the strongest signals for swing trading, while intraday fluctuations are less reliable due to noise in component data.
Are there seasonal patterns in the index?
Historical data shows slightly elevated fear readings during summer months and year-end periods, though these are secondary to broader cycle dynamics.
Conclusion
The Bitcoin Fear & Greed Index offers clear, actionable insights for 2026 market timing when applied with discipline and supporting data. By mastering its components, interpretation process, and integration with on-chain metrics, traders can navigate sentiment-driven swings with greater confidence and consistency across varying market environments.


No comments yet. Be the first!