 CryptoChain Blog
Introduction to Fusing Sentiment and On-Chain Data
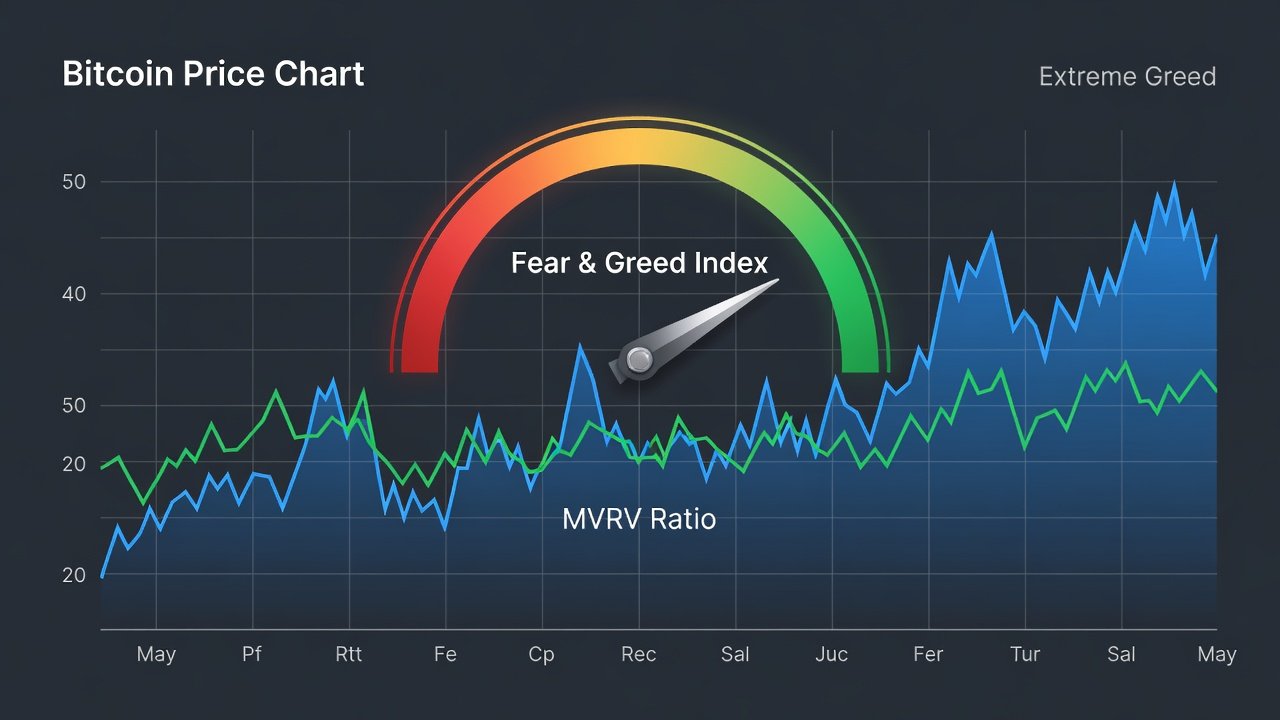
The Bitcoin Fear & Greed Index has long served as a popular sentiment gauge, but pairing it with on-chain metrics like realized price and MVRV ratio creates a more robust framework for 2026 market analysis. This guide explores the mechanics, historical patterns, and practical implementation steps for building a combined indicator system that helps traders navigate volatility with greater precision. By integrating behavioral signals with blockchain fundamentals, analysts can identify high-probability entry and exit points while accounting for evolving market structures such as institutional ETF participation.
Understanding the Bitcoin Fear & Greed Index
The index aggregates factors including volatility, market volume, social media activity, surveys, and dominance to produce a score from 0 (extreme fear) to 100 (extreme greed). Extreme readings often coincide with local tops and bottoms, yet relying solely on sentiment leaves gaps during structural shifts such as ETF inflows. The index is calculated daily and published publicly, making it an accessible starting point for any trader. Its strength lies in capturing crowd psychology, but it can lag during periods when large holders move differently from retail participants.
Key On-Chain Metrics: Realized Price and MVRV
Realized price represents the average cost basis of all Bitcoin holders, calculated by weighting UTXOs by their acquisition price. This metric provides a floor of support during bear markets and a resistance level in bull phases. MVRV, or Market Value to Realized Value, divides current market capitalization by realized capitalization to highlight over- or undervaluation zones. Historical data shows MVRV above 3.5 frequently precedes corrections, while values below 1 signal accumulation phases. Together these metrics offer objective context that pure price charts lack.
Historical Correlations Across Cycles
During the 2020-2021 cycle, Fear & Greed readings above 90 aligned with MVRV peaks near 4.2, preceding the May 2021 correction. In 2024-2025, similar divergences appeared when greed spiked while realized price lagged, foreshadowing consolidation periods before ETF-driven rallies. These patterns demonstrate that combining sentiment extremes with on-chain valuation creates clearer signals than either metric alone. Traders who waited for both indicators to align avoided several false breakouts that pure sentiment traders fell victim to.
Building a Combined Dashboard: Step-by-Step Workflow
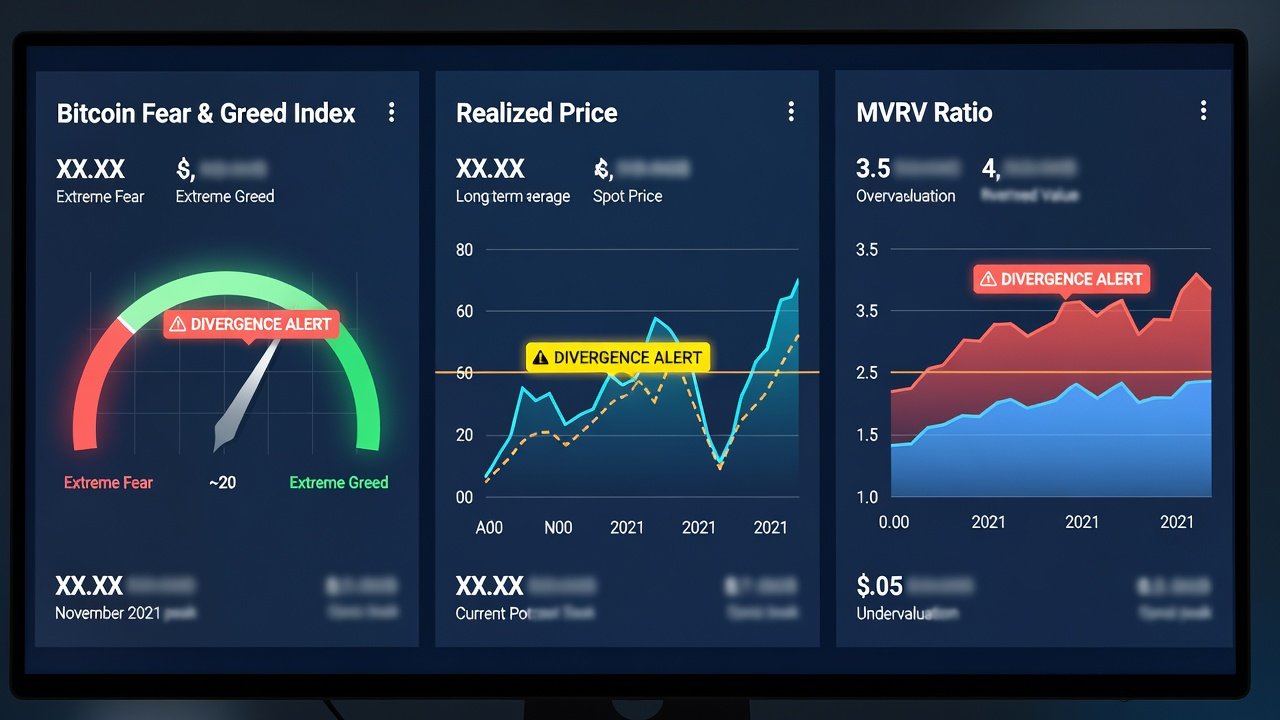
Creating a functional dashboard requires consistent data collection and simple visualization tools. Begin by collecting daily Fear & Greed data from public APIs. Next, fetch realized price and MVRV from on-chain explorers. Normalize both datasets on a 0-100 scale so they can be compared directly. Plot overlay charts and calculate divergence scores between the two. Finally, set threshold alerts for combined signals exceeding historical averages. Many analysts use spreadsheet software or free charting platforms to automate the overlay process and generate daily summaries.
Interpreting Divergences for Stronger Signals
When Fear & Greed shows extreme greed but MVRV remains moderate, it may indicate healthy institutional participation rather than retail euphoria. Conversely, fear readings paired with rising realized price can signal capitulation bottoms that precede rebounds. Divergences become especially powerful near cycle turning points. For example, a high greed reading accompanied by an MVRV below 2.5 in 2025 often marked sustainable uptrends driven by ETF accumulation rather than speculative bubbles.
Setting Alerts and Monitoring Routines
Configure daily alerts when the composite score crosses key levels, such as combined readings below 25 or above 75. Review data each morning using free public sources and cross-reference with ETF flow reports for 2026 context. A practical routine includes checking the dashboard before market open, noting any new divergences, and logging observations in a trading journal. Weekly reviews help identify longer-term shifts in correlation strength between sentiment and on-chain data.
Backtesting Simple Strategies with Public Data
Using historical datasets, test rules like entering long positions when Fear & Greed is below 20 and MVRV under 1.2. Out-of-sample validation across 2017-2025 cycles demonstrates improved risk-adjusted returns compared with sentiment alone. Backtesting should include transaction costs and slippage assumptions to reflect real-world execution. Public data sources allow anyone to replicate these tests without expensive subscriptions, though results should be validated across multiple market regimes.
Common Pitfalls and Adjustments for 2026 Conditions
Traders often overlook ETF flow impacts that can sustain elevated MVRV without immediate corrections. Adjust thresholds upward by 10-15% during high institutional inflow periods and always account for regulatory news that may skew social media components of the Fear & Greed Index. Another frequent mistake is ignoring data lag; realized price updates more slowly than price action, so combine it with real-time sentiment for timely decisions. Finally, avoid over-optimization by keeping rules simple and re-testing periodically as market structure evolves.
Practical Example: 2026 Scenario Analysis
Imagine a scenario where Bitcoin trades near all-time highs yet the Fear & Greed Index drops to 35 while MVRV hovers around 2.8. This combination might suggest healthy consolidation rather than an imminent top, especially if ETF inflows remain positive. Traders following the combined framework would maintain exposure while setting alerts for further deterioration in either metric. Such examples illustrate how the approach filters noise and supports disciplined positioning throughout the year.
Conclusion
Integrating the Fear & Greed Index with realized price and MVRV delivers a multidimensional view that helps navigate 2026 volatility more effectively. Consistent application of these workflows supports disciplined decision-making and reduces emotional trading. As the market matures with greater institutional involvement, these hybrid tools become even more valuable for both short-term traders and long-term holders.
FAQ
What free tools are best for combining these metrics?
Public explorers such as Glassnode (free tier) and CryptoQuant provide downloadable CSV files for realized price and MVRV, while the Alternative.me site offers the Fear & Greed API.
How often should I monitor the combined dashboard?
Daily checks suffice for most traders, with deeper weekly reviews to adjust for ETF flow trends and macro events.
Can these signals be used for short-term trading?
While the metrics work best on daily or weekly timeframes, intraday traders can use them as bias filters rather than precise entry triggers.
No comments yet. Be the first!