 CryptoChain Blog
Introduction to Funding Rate Arbitrage in 2026
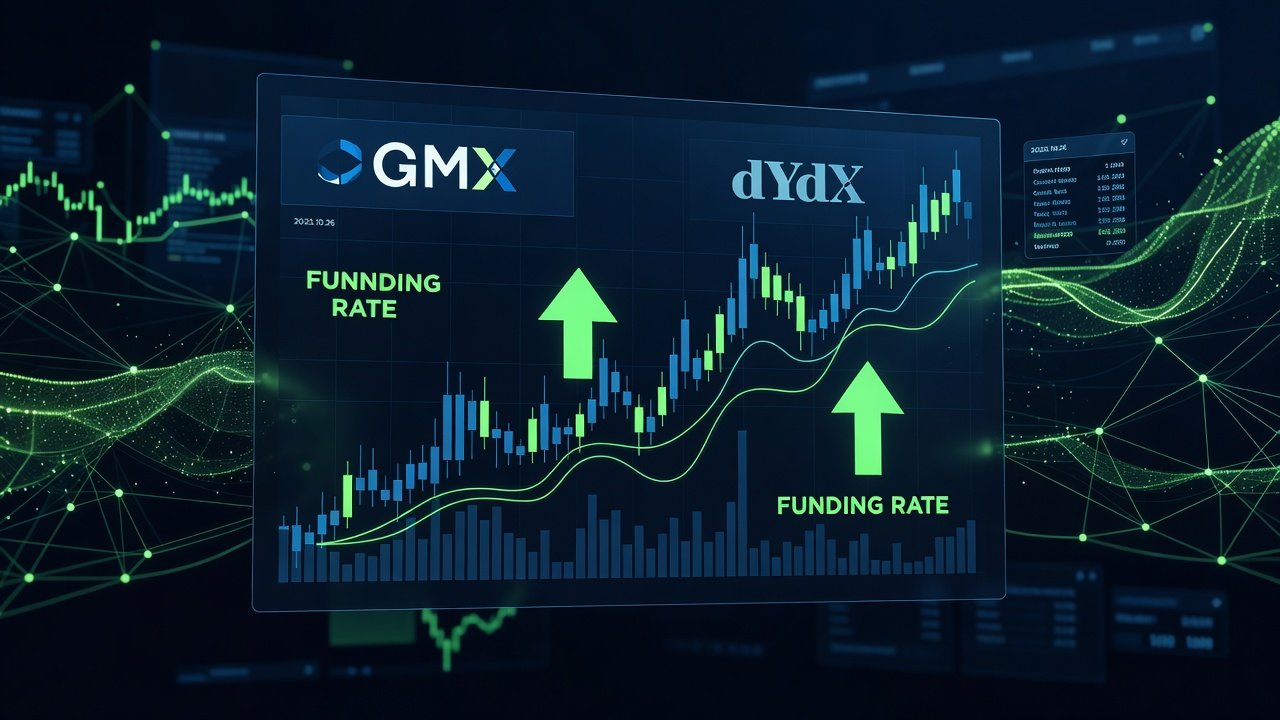
Funding rate arbitrage remains a cornerstone strategy for sophisticated DeFi traders navigating perpetual futures markets. In 2026, evolving protocols like GMX V3 and dYdX V5 introduce refined mechanics that reward precise execution and real-time monitoring. This approach exploits differences between spot and perpetual pricing while capturing positive funding payments across exchanges. Traders now combine cross-chain hedging with automated tools to scale positions safely. Success hinges on understanding liquidation buffers, position sizing formulas, and regulatory nuances such as tax reporting for profits. As perpetual markets mature, funding rates have become more volatile due to increased institutional participation and layered liquidity pools, creating both opportunities and pitfalls for those who fail to implement robust controls.
The core idea involves collecting funding payments when rates are positive by holding short perpetual positions, while hedging the underlying asset exposure through spot or opposing contracts on other venues. This neutralizes directional market risk and turns the strategy into a yield-generating mechanism. In practice, advanced practitioners monitor multiple chains simultaneously because funding APRs can diverge significantly between ecosystems like Arbitrum and the dedicated dYdX chain.
GMX V3 and dYdX V5 Mechanics Explained
GMX V3 operates on a liquidity pool model where traders interact with GLP vaults, enabling low-slippage perpetual trades funded by liquidity providers. Funding rates adjust dynamically based on open interest imbalances, creating arbitrage windows when rates turn persistently positive or negative. The protocol uses a unique multi-asset pool that allows traders to open positions in various assets without needing direct counterparties, which reduces slippage but introduces shared liquidity risks during extreme market moves.
dYdX V5 enhances this with isolated margin accounts and improved oracle integrations, allowing finer control over funding settlements every hour. Both platforms settle rates to keep perpetual prices aligned with spot indices, but differences in fee structures and chain-specific liquidity create exploitable spreads. GMX V3 tends to favor longer holding periods because of its vault-based funding distribution, whereas dYdX V5 rewards frequent rebalancing due to its hourly cadence. Understanding these settlement differences is essential for timing entries and exits to maximize captured funding while minimizing gas and borrowing costs.
Real-Time Funding Monitoring Dashboards
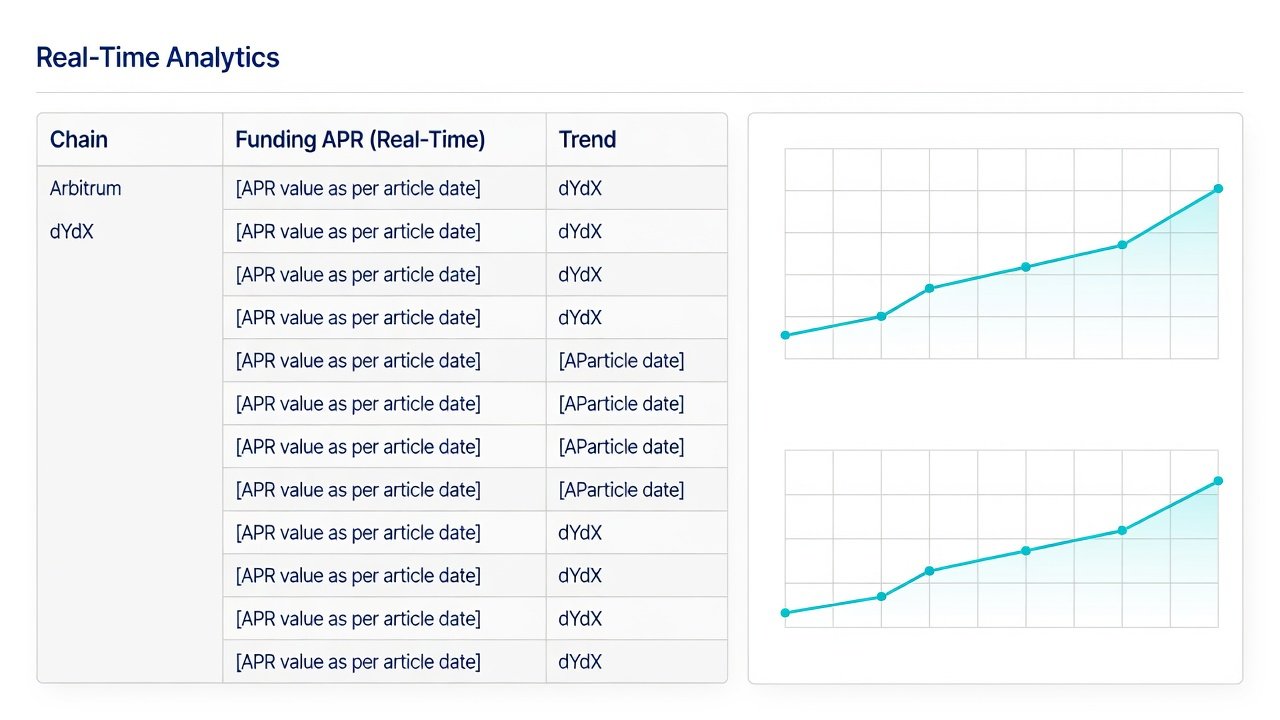
Effective arbitrage begins with dashboards that aggregate live funding APR data across chains. Platforms such as DefiLlama provide on-chain metrics, while protocol-native tools on GMX and dYdX display current rates and historical trends. Set alerts for APR thresholds above 20% annualized to identify high-yield opportunities. Advanced users often combine multiple data sources including on-chain event listeners and third-party analytics to detect rate spikes before they normalize. These dashboards typically show not only current rates but also projected yields based on position size and historical volatility, helping traders decide whether a setup justifies the associated smart-contract and liquidation risks.
Cross-Exchange Hedging Setups
Advanced setups involve longing the spot asset on one venue while shorting the perpetual on another to neutralize directional risk. For instance, a trader might hold ETH on a centralized exchange spot market and short the equivalent perpetual on dYdX V5 when funding turns positive. This locks in the funding payment as profit while the hedge minimizes price exposure. Cross-exchange hedging also extends to other Layer-2 networks where perpetual protocols offer different funding dynamics. Successful setups require careful calculation of transfer times, bridge fees, and potential oracle discrepancies that could temporarily break the hedge. Real-world examples from 2026 show traders maintaining 1:1 hedges across three or more venues simultaneously, rotating capital as funding rates shift between protocols.
Step-by-Step Trade Flow
- Monitor funding rates across GMX V3 and dYdX V5 via integrated dashboards and set automated alerts for favorable APR levels.
- Calculate net APR after fees using position sizing formulas: (Funding APR × Position Size) − (Borrow Fees + Gas Costs + Bridge Fees).
- Open opposing positions with liquidation buffers set at 150% of initial margin to withstand volatility spikes.
- Rebalance every 4–8 hours to capture compounding payments while monitoring oracle updates for any drift.
- Exit when rates normalize below target thresholds or when any risk parameter such as margin ratio breaches predefined limits.
- Document every transaction hash and settlement for later tax reconciliation.
Automated Bot Examples and Risk Controls
Python-based bots using Web3 libraries can automate entries when funding exceeds a threshold. Include liquidation buffers by dynamically adjusting leverage below 5x and enforcing position sizing that never exceeds 2% of total portfolio risk per trade. Backtest formulas against 2026 historical data to validate performance across volatile periods. Risk controls should incorporate circuit breakers that pause trading if funding rates move more than 50% within a single hour or if on-chain gas prices exceed acceptable ranges. Bots also need to handle partial fills and slippage by implementing limit-order logic instead of market orders during low-liquidity windows.
Position Sizing Formulas and Liquidation Buffers
Position sizing is critical to avoid forced liquidations during sudden funding reversals. A practical formula used by advanced traders is: Maximum Position = (Portfolio Equity × Risk Percentage) / (Liquidation Distance × Leverage). For example, with 10% portfolio risk tolerance and a 20% liquidation distance, the position should remain small enough that a 15% adverse move does not trigger liquidation. Liquidation buffers are maintained by keeping account health ratios above 1.5 at all times and by using isolated margin modes on dYdX V5 to ring-fence individual trades. Regular stress testing against historical drawdowns from 2025 and early 2026 helps calibrate these parameters for current market conditions.
Comparison of Funding APRs Across Chains
| Chain/Protocol | Average Funding APR (Recent) | Key Advantage | Typical Holding Period |
|---|---|---|---|
| GMX V3 (Arbitrum) | 18–35% | Deep GLP liquidity | 12–48 hours |
| dYdX V5 (dYdX Chain) | 22–42% | Hourly settlements | 4–12 hours |
| Other L2 Perpetuals | 12–28% | Lower gas costs | 24–72 hours |
FAQ on Tax Reporting for Arbitrage Profits
How are funding payments taxed? Most jurisdictions treat positive funding as ordinary income. Track each settlement separately using on-chain timestamps and maintain records of the exact USD value at the moment of receipt.
What records are required? Maintain detailed logs of entry/exit prices, fees, and net funding received. Consult local guidelines from authorities like the IRS for U.S. taxpayers or equivalent bodies in other regions.
Are cross-chain hedges considered taxable events? Transfers between wallets may trigger capital gains calculations; document basis adjustments carefully and consider using specialized crypto tax software that supports DeFi transaction imports.
How should losses from failed hedges be reported? Losses can often offset gains but require clear documentation proving the hedge intent and execution details to satisfy audit requirements.
Conclusion
Mastering DeFi funding rate arbitrage in 2026 demands integration of advanced protocol knowledge, robust monitoring, and disciplined risk management. By applying the tactics outlined above, traders can pursue consistent yields while mitigating downside exposure in perpetual markets. Continuous education on protocol upgrades and regulatory changes remains essential for long-term success in this evolving space.
No comments yet. Be the first!