 CryptoChain Blog
Introduction to Sentiment-Volatility Fusion in Bitcoin Trading
Bitcoin traders in 2026 face increasingly complex markets where price action alone often fails to capture full context. Combining sentiment analysis with volatility forecasting creates a powerful edge for identifying reversals and optimizing position sizing. This approach moves beyond traditional models by layering real-time social and on-chain signals onto metrics like Average True Range (ATR) and implied volatility. Traders who integrate these elements can better anticipate shifts driven by news cycles, whale activity, and macroeconomic events. The result is improved timing for entries and exits in both spot and derivatives markets. In an era of rapid information flow, ignoring sentiment leaves traders vulnerable to sudden sentiment-driven swings that volatility metrics alone cannot predict.
Understanding the interplay between crowd psychology and market volatility allows for more nuanced decision-making. For instance, when bullish sentiment builds steadily while volatility contracts, it often signals an impending expansion phase ripe for long positions. Conversely, bearish sentiment surges amid rising implied volatility frequently mark exhaustion points suitable for short setups or protective hedging.
Primary Sources of Bitcoin Sentiment Data
Effective fusion starts with reliable sentiment inputs. Key sources include social media platforms like X (formerly Twitter), on-chain metrics from blockchain explorers, and aggregated news feeds. On-chain data such as exchange inflows and active addresses often signal shifts in holder behavior before price reacts. Monitoring whale wallet movements through public ledgers provides early warnings of large-scale accumulation or distribution that can amplify volatility. Social sentiment trackers quantify the ratio of positive to negative mentions across thousands of posts, offering a real-time pulse on retail and institutional mood. News aggregation services scan mainstream and crypto-specific outlets to detect spikes in coverage that historically correlate with volatility expansions. Traders frequently monitor tools that quantify bullish versus bearish mentions across forums and news outlets. These signals gain strength when cross-referenced with volatility indicators, revealing when market complacency or fear aligns with expanding or contracting ranges. Combining multiple sources reduces noise from any single platform's bias.
Key Volatility Metrics: ATR and Implied Volatility
Average True Range measures market volatility by averaging the true range over a set period, helping quantify typical price swings. Implied volatility, derived from options pricing, reflects expected future movement and often spikes ahead of major events such as regulatory announcements or macroeconomic releases. ATR is particularly useful for setting stop-loss levels because it adapts to current market conditions rather than fixed percentages. Implied volatility from Bitcoin options chains provides forward-looking insight that historical volatility cannot match. Correlating these with sentiment allows traders to spot divergences. For example, rising positive sentiment paired with declining ATR may indicate building momentum before a breakout, while negative sentiment during high implied vol can foreshadow sharp reversals. Traders can calculate ATR on multiple timeframes to confirm consistency across short-term noise and longer-term trends.
Correlation Techniques for Enhanced Signals
Advanced traders apply statistical methods such as Pearson correlation or rolling window analysis to link sentiment scores with volatility readings. A strong positive correlation between bearish sentiment spikes and ATR expansion often precedes downside moves. Machine learning models can refine these relationships by weighting recent data more heavily. This technique improves accuracy in 2026's fast-moving environment where sentiment can shift within minutes. Rolling correlations over 20-period windows help identify regime changes where the relationship between sentiment and volatility strengthens or weakens. Traders should also consider lagged correlations to account for the time it takes for sentiment to fully impact price action. 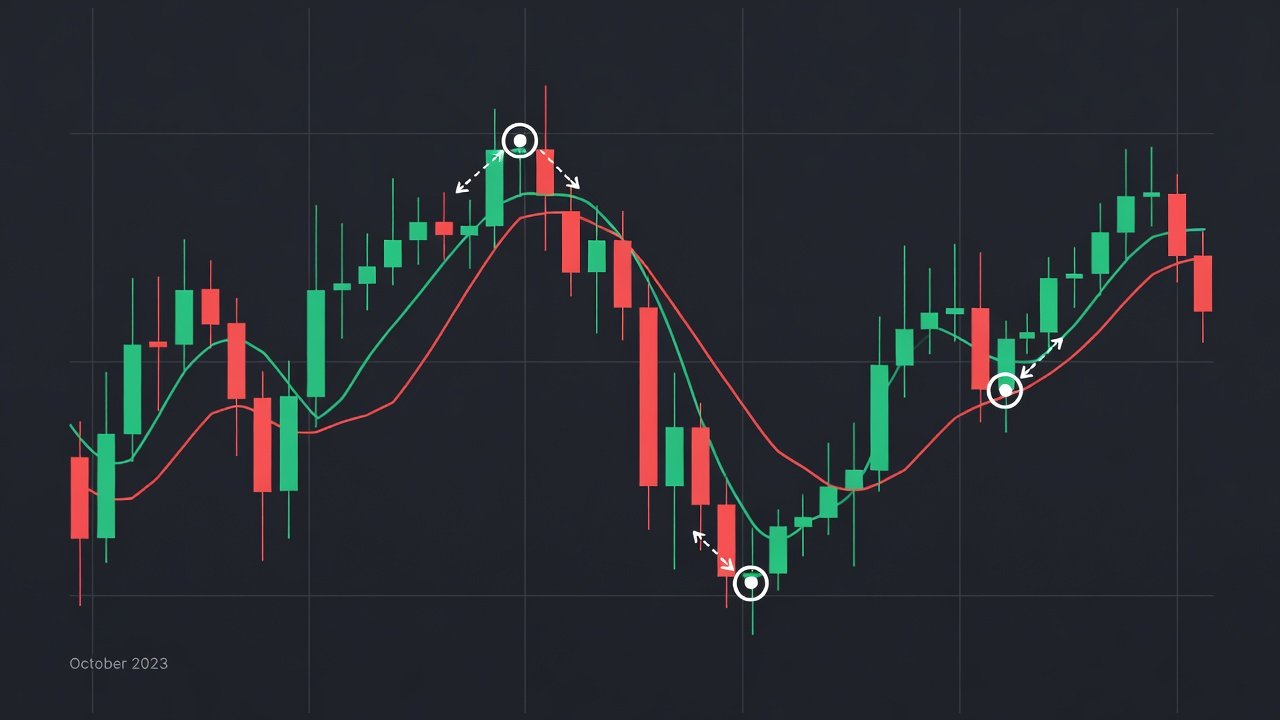
Bitcoin.org provides foundational resources on market mechanics that complement these quantitative approaches.
Step-by-Step Integration Workflow
Follow this practical workflow to fuse the two data streams: First, collect sentiment scores from multiple APIs at regular intervals such as every five minutes during active trading sessions. Second, calculate ATR and implied vol using standard formulas on 1-hour or 4-hour charts while ensuring data consistency across exchanges. Third, normalize both datasets to a 0-100 scale for direct comparison, adjusting for outliers that could skew results. Fourth, identify confluence zones where sentiment extremes align with volatility thresholds, such as sentiment above 80 paired with ATR in the top quartile. Fifth, apply filters for false signals, such as low-volume periods or weekends when liquidity thins. Sixth, execute trades with dynamic position sizing based on the strength of the fused signal, reducing exposure when correlations are weak. This process helps detect reversals earlier than volatility-only models. Additional steps include backtesting the workflow on at least two years of historical data and maintaining a trading journal to log fusion signal outcomes for continuous refinement.
Historical Pattern Examples
During the 2024-2025 bull cycle, periods of extreme positive sentiment coinciding with compressed ATR often preceded major upward breakouts. Conversely, sentiment crashes paired with implied vol surges accurately flagged local tops in several instances. In one notable case from mid-2025, a sudden influx of negative social mentions aligned with a sharp rise in implied volatility, preceding a 15% pullback within 48 hours. Similar patterns emerged around regulatory news events where sentiment turned bearish ahead of volatility spikes. These patterns repeat because human psychology and market structure remain consistent even as technology evolves. Reviewing past charts with overlaid sentiment layers reveals repeatable setups for 2026 application. Traders can replicate these by overlaying normalized sentiment curves on volatility heatmaps to visualize historical confluences.
Practical Trader Checklists
- Verify data sources for latency under 5 minutes before trading and cross-check against at least two independent providers.
- Confirm at least two sentiment indicators align with volatility shift to increase signal conviction.
- Adjust position size downward when correlation strength is moderate, perhaps halving exposure until confirmation appears on higher timeframes.
- Monitor for macroeconomic news that could override technical signals, including Federal Reserve announcements or geopolitical developments.
- Review weekly performance of the fusion model and recalibrate weights based on recent accuracy metrics.
- Document every trade triggered by the model, noting entry rationale, exit plan, and post-trade outcome for pattern recognition.
Common Pitfalls to Avoid
Over-reliance on a single sentiment source leads to biased signals that may not reflect broader market consensus. Ignoring data lag between sentiment publication and price impact often results in late entries that erode potential profits. Traders should also avoid trading during low-liquidity hours when volatility metrics become unreliable and prone to manipulation. Another frequent mistake is failing to account for regime changes, such as post-halving dynamics that alter how sentiment influences volatility. Additionally, neglecting to update correlation models after major market structure shifts can cause outdated signals. Finally, emotional overrides of the quantitative fusion output frequently lead to suboptimal decisions during high-stress periods.
FAQ: Addressing Data Lag Issues
How does data lag affect fusion accuracy?
Lag between sentiment collection and volatility calculation can reduce signal reliability by 10-20% in fast markets. Mitigate this by using real-time APIs and buffering recent data points with timestamp alignment.
What tools minimize lag in 2026?
Modern platforms offer sub-second updates for both sentiment and options-derived volatility, though always test latency in your specific setup across different network conditions.
Can lag create false reversals?
Yes, delayed negative sentiment during a volatility spike may falsely suggest a reversal that has already occurred. Cross-checking multiple timeframes and incorporating volume filters helps reduce these erroneous triggers.
How should traders handle weekend data gaps?
Weekend gaps in both sentiment and volatility data require conservative position sizing or complete avoidance of new entries until Monday liquidity returns and fresh signals emerge.
Investopedia offers in-depth explanations of volatility concepts that support robust model building.
Conclusion
Bitcoin sentiment-volatility fusion delivers a measurable trading edge in 2026 by combining qualitative market mood with quantitative range expectations. Implementing the workflows, checklists, and safeguards outlined above positions traders to capture reversals and manage risk more effectively than with isolated indicators. Continuous refinement through backtesting and real-time monitoring ensures the strategy adapts to evolving market conditions throughout the year.

No comments yet. Be the first!