 CryptoChain Blog
Understanding Bitcoin Funding Rates in Perpetual Futures
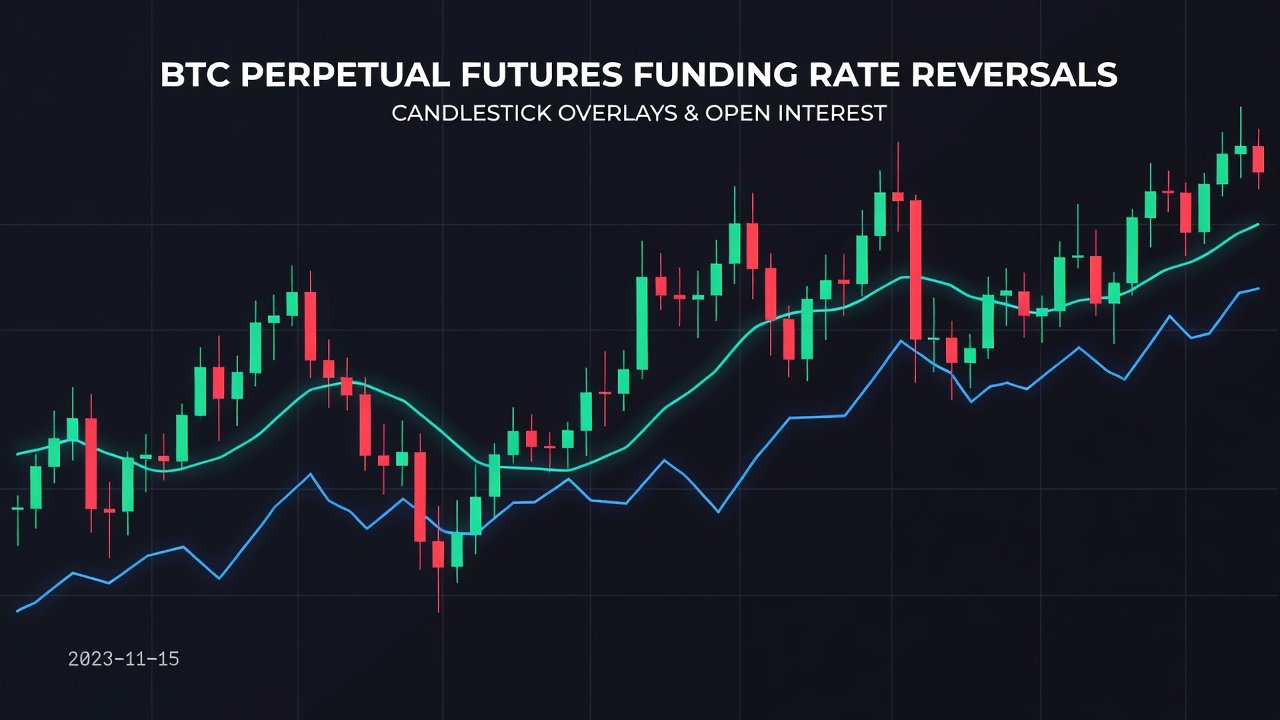
Bitcoin perpetual futures contracts dominate crypto derivatives trading, and funding rates serve as the primary mechanism balancing long and short positions. These periodic payments between traders reflect market sentiment and can highlight potential reversals when they reach extremes. In 2026, sophisticated traders monitor funding rate behavior alongside open interest to anticipate shifts before they appear in spot prices. Funding rates act as a real-time gauge of leverage enthusiasm, making them essential for anyone trading Bitcoin derivatives beyond basic price charts.
Funding rates are calculated every eight hours on most platforms and expressed as a percentage. Positive rates indicate longs pay shorts, signaling bullish dominance, while negative rates show the opposite. Extreme readings often precede reversals because they represent overcrowded positions vulnerable to liquidation cascades. Understanding the exact formula—typically based on the difference between perpetual contract price and spot index—helps traders interpret why rates spike during news events or trend accelerations.
Core Mechanics and Divergence Signals
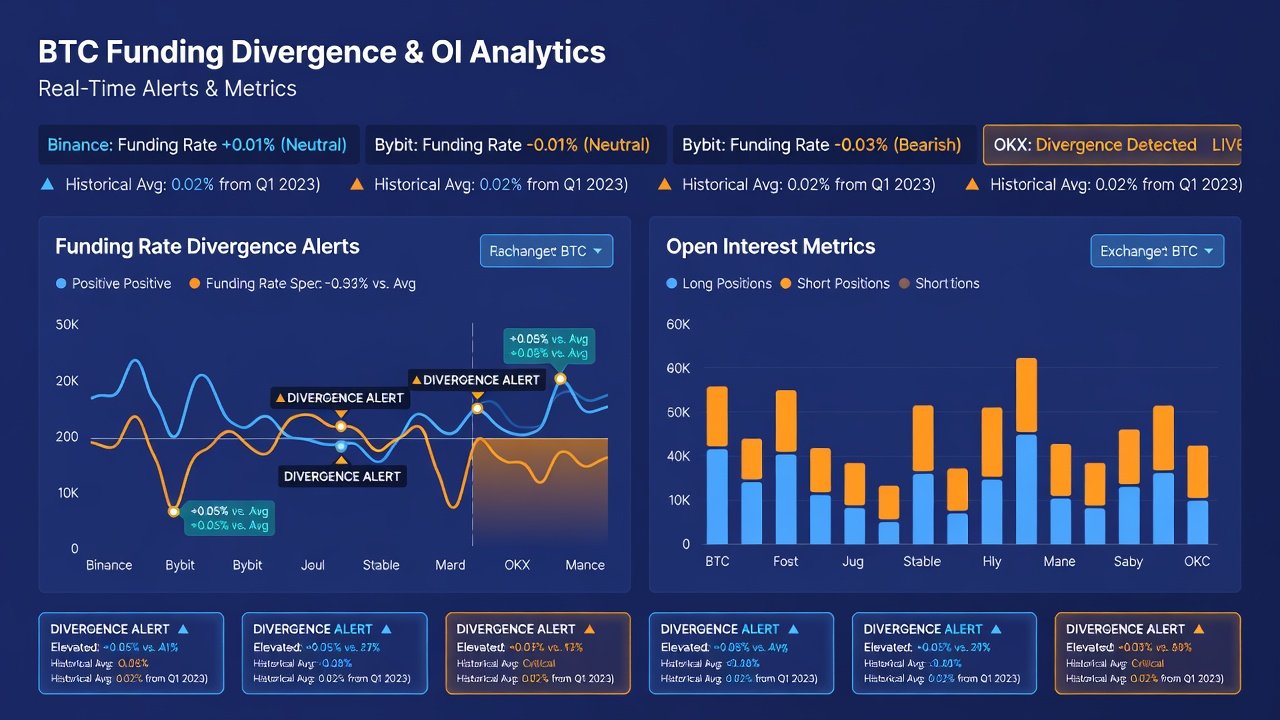
Funding rate extremes alone provide clues, but divergences between rates and price action or open interest offer stronger reversal signals. For instance, when Bitcoin price climbs to new highs yet funding rates fail to confirm with higher positives, it suggests weakening conviction among longs. Conversely, deeply negative rates during a price bottom can mark capitulation and an impending bounce. Divergences gain power when combined with volume profiles and funding rate velocity, showing not just the level but the speed of sentiment change.
Traders integrate open interest data to validate these divergences. Rising open interest with extreme positive funding often builds a setup for a long squeeze, while falling open interest during negative funding may indicate shorts exiting prematurely. This integration creates a multi-layered confirmation process that reduces false positives common in single-indicator strategies.
Historical Case Studies from Prior Cycles
Analysis of 2021 and 2024 Bitcoin cycles reveals recurring patterns. In early 2021, funding rates surged above 0.1% daily averages during the April rally, followed by a sharp reversal as rates normalized. Similar dynamics appeared in late 2024 when prolonged positive funding preceded the March correction. These examples demonstrate how funding rate reversals act as leading indicators rather than lagging ones. A deeper look at the 2022 bear market shows negative funding persisting for weeks before the November low, with open interest contracting sharply just before the reversal rally began.
Traders who tracked divergences between funding rates and open interest successfully navigated both bull and bear phase transitions by exiting crowded sides early. Reviewing these cycles highlights the importance of context: the same rate level can mean different things depending on the broader market regime and macro backdrop.
Funding Rate Behavior: Bull vs Bear Phases
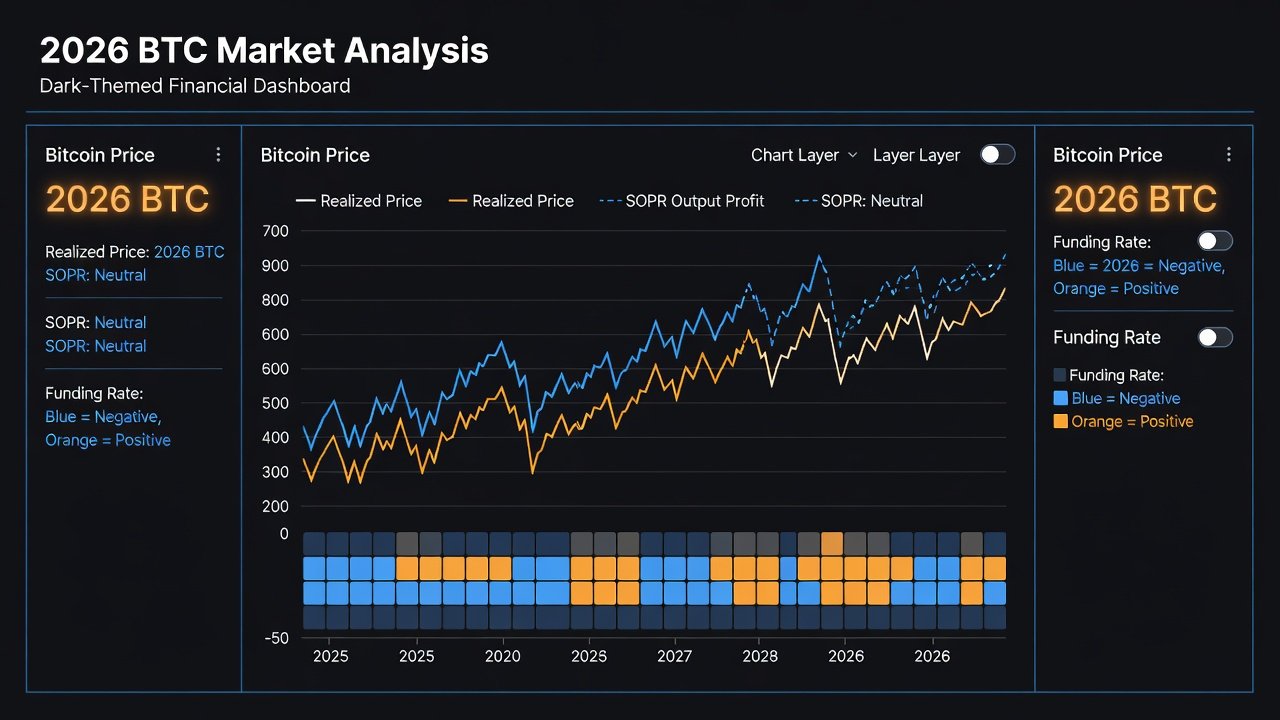
During bull phases, funding rates tend to stay elevated for extended periods as optimism fuels leverage. Reversals typically occur when rates spike to unsustainable levels and then rapidly decline, often coinciding with open interest peaks. Bear phases produce the opposite: prolonged negative funding that bottoms out before a relief rally begins. Seasonal factors such as options expirations or quarterly settlements can amplify these behaviors, requiring traders to adjust their interpretation frameworks accordingly.
Comparing the two environments helps traders adjust thresholds. Bull market extremes may require rates above 0.08% daily to trigger alerts, while bear market signals activate at -0.06% or lower. Understanding these phase-specific nuances prevents misreading normal volatility as reversal setups.
Integrating Funding Rates with Additional Indicators
Advanced practitioners rarely rely on funding rates in isolation. Combining them with RSI divergences, CVD (cumulative volume delta), and exchange-specific liquidation maps creates higher-conviction signals. For example, a funding rate reversal accompanied by a CVD flip from negative to positive often precedes stronger moves than funding data alone. This multi-indicator approach mirrors professional desk workflows and adds robustness during high-volatility 2026 sessions.
Real-Time Monitoring Workflows with Free Tools
Advanced traders combine data from multiple sources for accurate monitoring. Start with exchange APIs or dashboards that display live funding rates across major perpetual pairs. Cross-reference with open interest charts and liquidation heatmaps to spot divergences quickly. Coinglass provides comprehensive funding rate histories and comparisons across exchanges, while TradingView offers customizable open interest overlays that integrate seamlessly with price action.
Free resources include aggregator sites that compile funding data from top exchanges and on-chain analytics platforms offering historical overlays. Set custom alerts for rate thresholds and divergence conditions to receive notifications without constant screen time. Building a simple spreadsheet or lightweight script to pull public API data allows for personalized dashboards that track multiple symbols simultaneously.
Step-by-Step Interpretation Methods
- Record daily average funding rates and compare against a 30-day moving average to establish baseline norms.
- Identify extremes exceeding two standard deviations from the mean for statistical significance.
- Check for divergence with Bitcoin price and open interest trends over multiple timeframes.
- Confirm with volume and liquidation clusters before acting on any signal.
- Define entry or exit rules based on rate normalization speed and supporting indicators.
- Backtest the full sequence on historical data to calibrate alert sensitivity.
Practical Entry and Exit Alert Examples
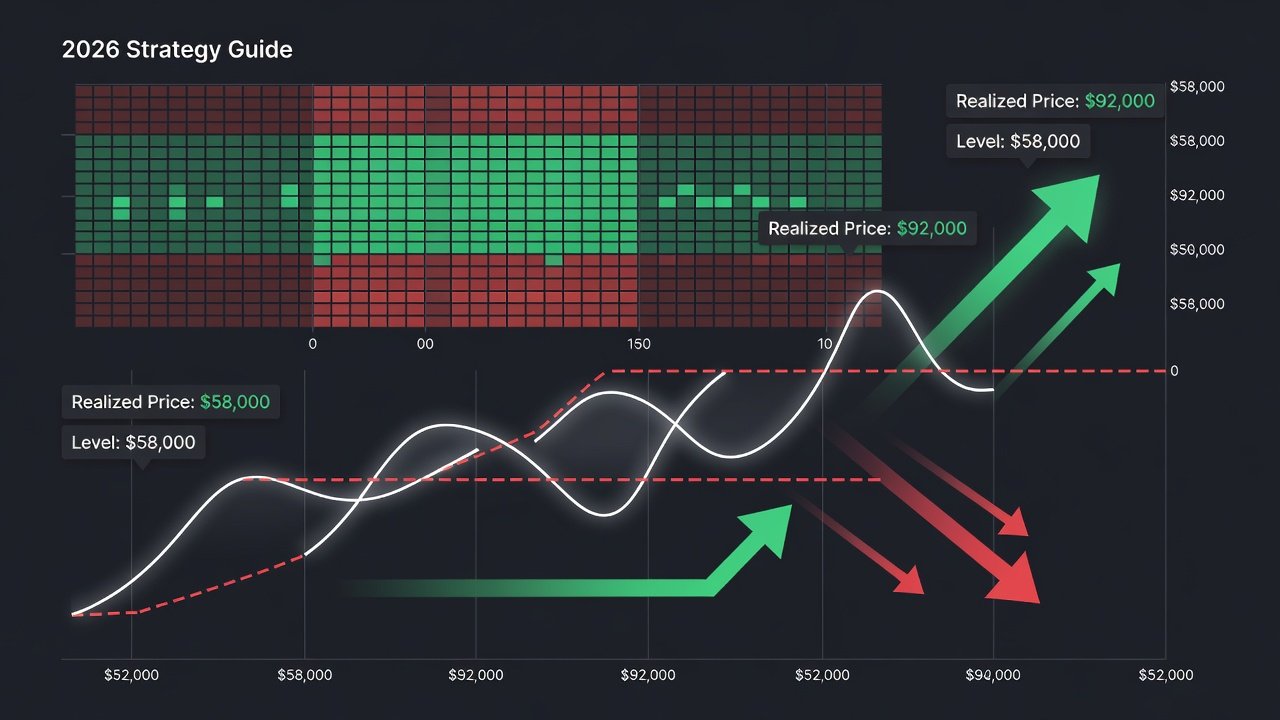
Consider a scenario where funding rates reach +0.12% while price stalls: an alert triggers to reduce long exposure or prepare short entries on rate pullback below +0.05%. In bear conditions, rates hitting -0.09% with stabilizing open interest prompt alerts for long entries once rates recover above -0.03%. Documenting these alerts in a trading journal with screenshots of the full market context improves pattern recognition over time.
These alerts integrate with position sizing rules to maintain disciplined execution across volatile sessions. Scaling entries in thirds as confirmation builds helps manage slippage during fast reversals.
Risk Management Tips for Funding-Based Trades
- Never risk more than 1-2% of capital on any single reversal signal regardless of conviction level.
- Use stop-loss orders placed beyond recent swing highs or lows to account for wick volatility typical in funding-driven moves.
- Scale into positions gradually as funding rates confirm the reversal direction.
- Maintain a journal logging each signal, outcome, and market context for ongoing refinement.
- Avoid trading during low-liquidity periods when funding data can become noisy or manipulated.
- Review weekly performance metrics to identify any systematic biases in signal interpretation.
Common Pitfalls and How to Avoid Them
Many traders fall into predictable traps when using funding rates. Over-reliance on absolute levels without considering the prevailing market phase leads to frequent false signals. Another common error involves ignoring exchange-specific differences in funding calculation methods, which can distort comparisons. Finally, failing to account for weekend gaps or major news events can turn a promising setup into a losing trade.
Short FAQ on Funding Rate Reversals
How do I avoid false signals from temporary funding spikes? Require confirmation from open interest trends and at least 24 hours of sustained rate behavior before entering any position.
Should I rely solely on funding rates? No. Combine with broader market structure, macroeconomic events, and on-chain metrics for higher probability setups that withstand unexpected shocks.
What happens if exchanges change funding intervals? Monitor platform announcements and adjust your monitoring scripts accordingly to maintain accuracy across all data sources.
Can funding rates predict exact reversal prices? They provide directional bias and timing clues but work best when paired with precise support and resistance levels derived from price action.
Conclusion
Bitcoin funding rate reversals provide a powerful edge for 2026 perpetual futures traders when analyzed with open interest and historical context. By building robust monitoring workflows and adhering to strict risk rules, advanced participants can capitalize on sentiment extremes before the broader market reacts. Consistent application of these methods transforms raw funding data into actionable trading decisions that compound over multiple cycles.
No comments yet. Be the first!