 CryptoChain Blog
Introduction to Advanced Bitcoin Market Analysis in 2026
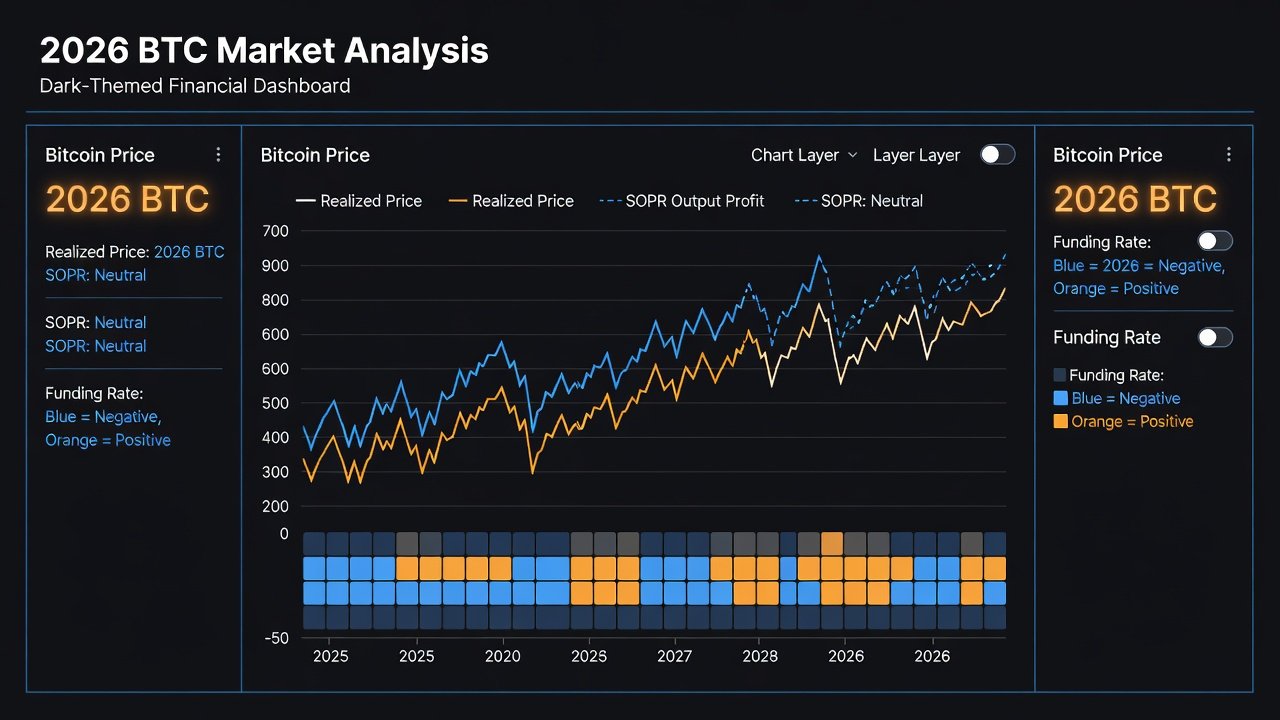
In 2026, Bitcoin traders face increasingly complex market dynamics driven by institutional adoption, regulatory developments, and macroeconomic shifts. Basic indicators often fall short when volatility spikes unexpectedly. This comprehensive guide shows how merging on-chain signals such as realized price and SOPR with perpetual futures funding rates creates deeper, more reliable insights into potential market reversals and continuations. Readers gain practical workflows, historical context from prior cycles, real-time data integration methods, and risk management techniques that go beyond single-metric approaches commonly found in basic funding rate guides.
The core strategy focuses on identifying high-probability reversal points and trend continuations by cross-referencing on-chain holder conviction with derivatives market sentiment. By layering these signals, traders can filter out noise and act on confluence rather than isolated data points. Established platforms provide the necessary data feeds for building automated monitoring systems that deliver timely alerts during critical periods.
Key On-Chain Metrics Explained in Detail
Realized price calculates the average acquisition cost of all Bitcoin currently in circulation, weighted by the price at which each coin last moved on-chain. When the current spot price diverges significantly above realized price, it often signals overvaluation as newer buyers hold unrealized losses. Conversely, when spot trades well below realized price, it may indicate undervaluation and strong accumulation zones. SOPR, or Spent Output Profit Ratio, measures the aggregate profit or loss realized by coins moved in a given period. Values consistently above 1 reflect profitable spending behavior that frequently marks local tops during periods of market euphoria, while readings below 1 highlight loss realization typical of capitulation phases.
These metrics offer a fundamental lens into long-term holder behavior and supply dynamics that pure price action cannot capture. Historical analysis across multiple cycles demonstrates that combining them with derivatives data improves signal accuracy by confirming whether leverage aligns with on-chain conviction or contradicts it.
Understanding Perpetual Funding Rates and Their Role
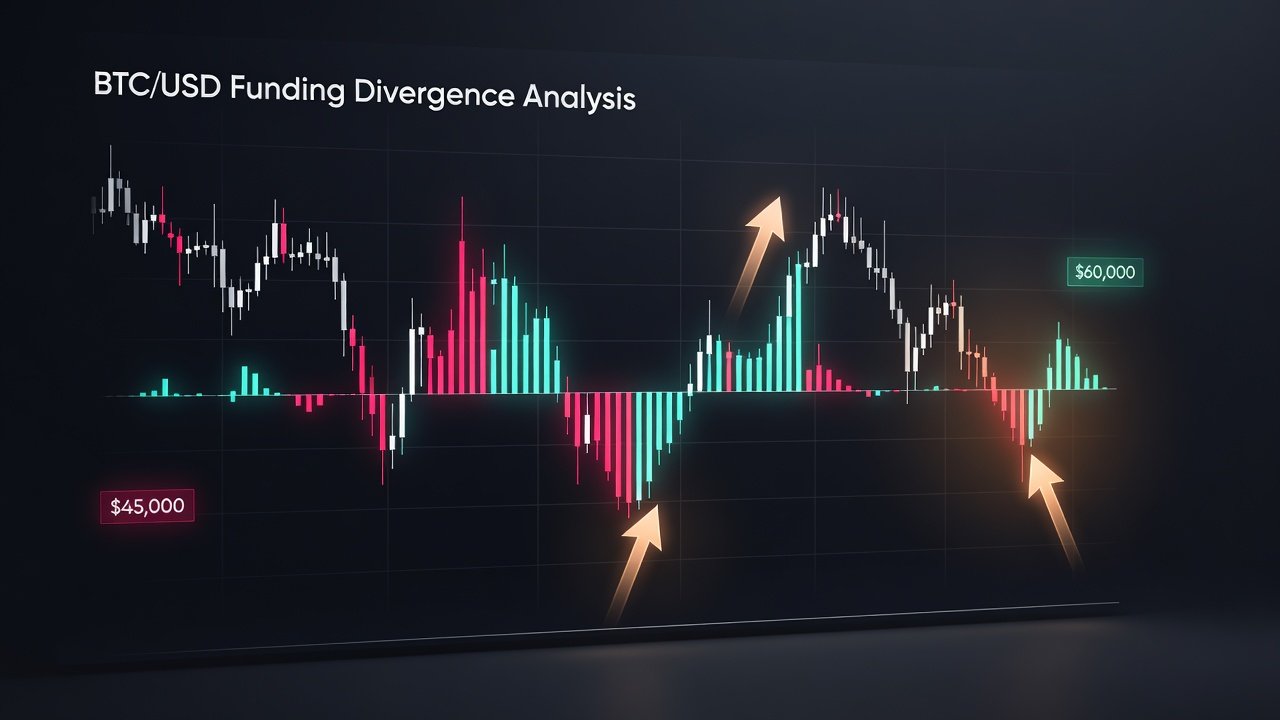
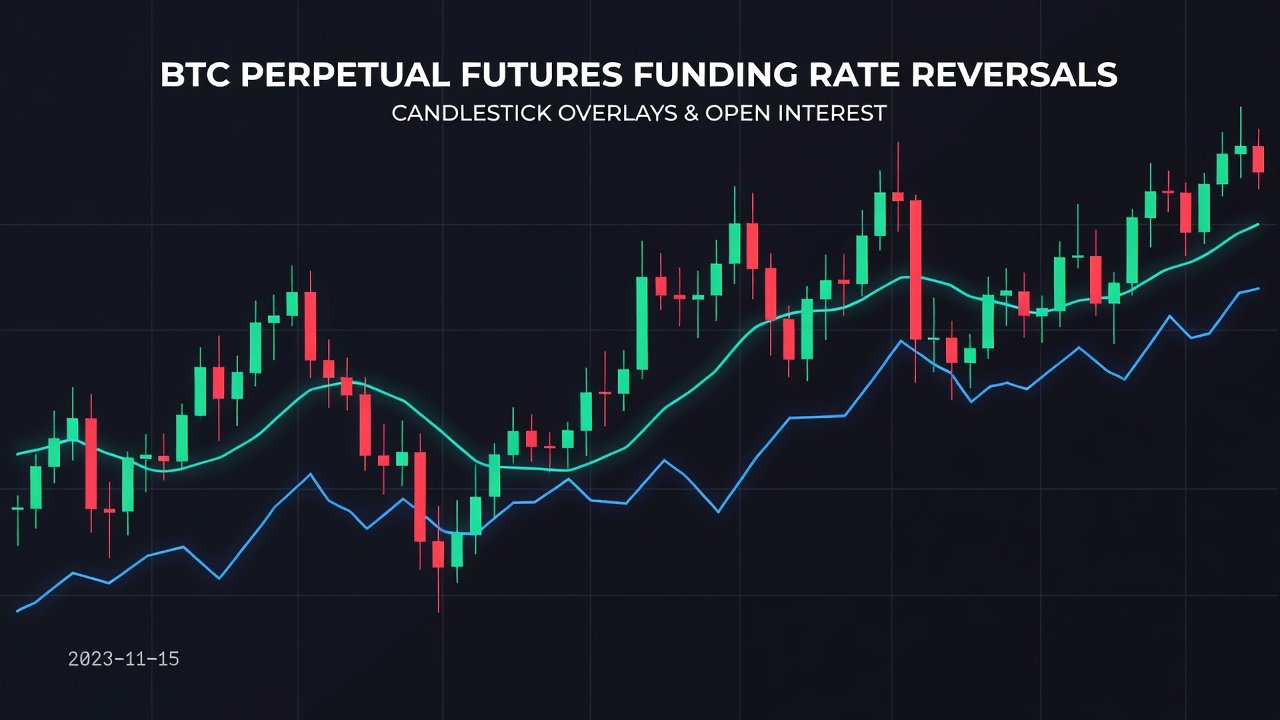
Funding rates in perpetual futures contracts represent the periodic payments exchanged between long and short positions to keep the contract price anchored to the spot market. Positive rates indicate that longs are paying shorts, reflecting bullish leverage buildup. Negative rates show shorts paying longs, often during fear-driven selloffs. Extreme positive or negative funding levels frequently precede reversals because over-leveraged positions become fragile when sentiment shifts.
When funding rates remain elevated while on-chain metrics like SOPR stay high, the combination warns of unsustainable optimism. Traders who monitor both avoid entering positions solely on funding rate extremes without confirmation from holder behavior data.
Historical Correlation Patterns Across Prior Cycles
Reviewing Bitcoin cycles from 2017, 2021, and intermediate corrections reveals recurring multi-signal patterns. In late 2021, realized price lagged spot price by over 25 percent while daily funding rates averaged above 0.05 percent and SOPR remained elevated. Similar setups preceded the 2017 peak. These confluences typically led to sharp corrections within days or weeks. In 2026, monitoring for analogous divergences helps anticipate shifts earlier than relying on funding rates alone.
The merged approach reduces false positives during sideways markets where isolated funding rate spikes occur without on-chain confirmation. Backtesting these combined conditions on historical datasets consistently shows improved timing and fewer whipsaws compared to standalone use of either indicator family.
Essential Data Sources, APIs, and Integration Methods
Glassnode supplies detailed on-chain dashboards covering realized price, SOPR, and related metrics with both web interfaces and robust API access for automated queries. Glassnode allows developers to pull daily or hourly data points directly into custom scripts. For perpetual funding rates and open interest, Coinglass aggregates real-time data across major exchanges. Coinglass provides clean endpoints suitable for integration into alert systems.
Direct exchange APIs from Binance and Bybit enable polling of funding history and open interest. Combining these sources creates a resilient multi-signal monitoring stack. Traders can schedule hourly data pulls, calculate divergences programmatically, and trigger notifications when predefined thresholds are crossed.

Step-by-Step Workflow for Building Custom Alerts
- Authenticate with the Glassnode API and retrieve daily realized price alongside SOPR values for the past 90 days.
- Poll funding rate averages from Coinglass or exchange endpoints, calculating 24-hour and 7-day moving averages.
- Define clear alert thresholds such as a 15 percent realized price divergence combined with a funding rate flip from positive to negative territory.
- Implement simple Python scripts using libraries like requests, pandas, and schedule to process data and evaluate conditions every hour.
- Route confirmed alerts to Telegram bots, Discord channels, or email services for immediate delivery to the trading desk.
- Log all signals in a database for later performance review and parameter refinement.
This structured workflow transforms raw data into actionable intelligence, allowing traders to respond proactively instead of chasing price after moves have already begun.
Practical Reversal Signal Examples and Scenarios
Imagine Bitcoin trading 22 percent above realized price while SOPR holds above 1.25 and funding rates average 0.08 percent daily. Historical analogs suggest a high probability of near-term correction. In such cases, reducing long exposure or tightening stops becomes prudent. On the flip side, when spot price falls 18 percent below realized price, SOPR dips below 0.92, and funding rates turn sharply negative, the setup often marks local bottoms where accumulation can begin with defined risk.
Traders should backtest these exact parameter combinations on at least three prior cycles before deploying live capital. Adjusting thresholds based on current market regime improves reliability during 2026 conditions.
Integrating Robust Risk Management Practices
Even strong multi-signal setups require disciplined risk controls. Limit risk to 1-2 percent of total portfolio per trade and always place stop-loss orders below key on-chain levels such as realized price or recent SOPR inflection points. Scale out of positions gradually when funding rates normalize or on-chain metrics show early signs of exhaustion. Maintain a trading journal documenting each signal confluence, entry rationale, and outcome to identify patterns for continuous improvement.
Expanded Case Study: 2026 Volatility Events
During the sharp volatility episodes of early 2026 triggered by unexpected regulatory headlines, the combined signals proved particularly valuable. Realized price remained relatively stable while funding rates first spiked to extreme positives then reversed to negative within 48 hours. SOPR followed a similar trajectory, peaking then dropping below 1.0. Traders monitoring both on-chain and funding data exited long positions ahead of the initial drop and re-entered on stabilization of SOPR near 0.95, capturing the subsequent recovery more effectively than those using funding rates in isolation. This episode underscores the advantage of multi-signal depth when macro events drive rapid sentiment changes.
Comparisons to Standalone Indicators and Common Pitfalls
Funding rates alone capture leverage sentiment but ignore underlying holder conviction. On-chain metrics alone miss the leverage buildup that can amplify moves. The merged framework reduces noise and improves decision quality. Common pitfalls include over-optimizing thresholds on limited historical data, ignoring exchange-specific funding variations, and failing to account for sudden news catalysts. Always cross-verify signals across multiple timeframes and maintain flexibility during low-liquidity periods.
Frequently Asked Questions
How often should traders review or refresh alerts?
Hourly automated checks work well for most strategies, although periods of elevated volatility may benefit from 15-minute polling intervals through scripted solutions.
Do these techniques require programming knowledge?
Basic scripting helps with automation, yet many platforms now offer no-code alert builders that connect directly to Glassnode and funding data feeds.
Are the signals effective across all market regimes?
They perform best during cycle transitions and high-volatility windows. In prolonged low-volatility ranges, additional filters such as volume analysis become necessary to avoid whipsaws.
Can the approach be adapted for altcoin trading?
Core principles transfer, but on-chain data depth is lower outside Bitcoin. Most practitioners apply the method primarily to BTC and use it as a market-direction filter for altcoin positions.
Conclusion
Merging on-chain signals with funding rates provides traders a sophisticated yet practical framework for navigating 2026 Bitcoin markets. By implementing the detailed workflows, studying historical patterns, and adhering to strict risk protocols, market participants can achieve more consistent results than with basic single-indicator strategies. Continuous refinement based on live performance data will further enhance effectiveness over time.
No comments yet. Be the first!