 CryptoChain Blog
Understanding Bitcoin Funding Rates in Perpetual Futures
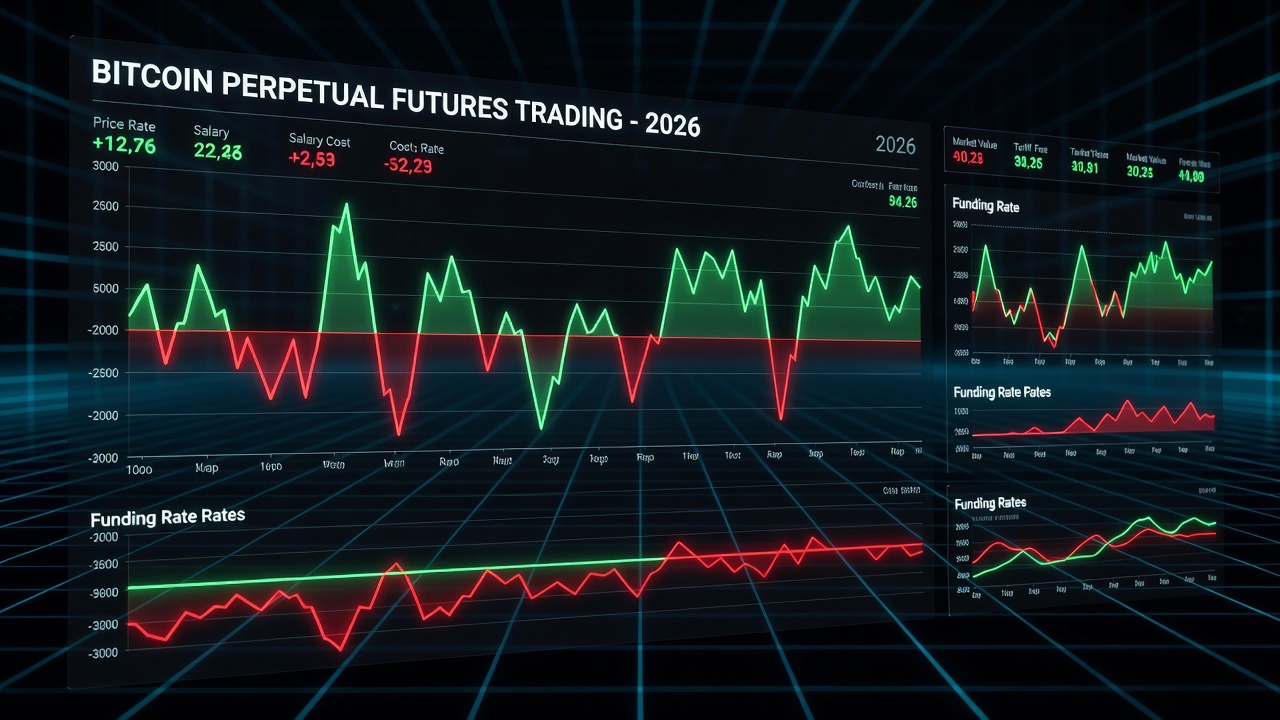
Bitcoin perpetual futures contracts have become a cornerstone of crypto derivatives trading, allowing traders to speculate on BTC price movements without expiration dates. Funding rates serve as the primary mechanism that keeps these contracts aligned with the spot market price. In 2026, analyzing these rates provides critical insights into market sentiment, potential reversals, and overall trader positioning across global exchanges.
Funding rates represent periodic payments exchanged between long and short positions. When the rate is positive, longs pay shorts, indicating bullish dominance. Negative rates flip this dynamic, with shorts compensating longs during bearish conditions. This built-in balancing act prevents perpetual contracts from drifting too far from spot prices and helps maintain market efficiency even during periods of high leverage.
Mechanics of Funding Rate Calculations
Funding rates are typically calculated every eight hours on major platforms. The formula incorporates the difference between the perpetual contract price and the underlying spot index, adjusted by a premium or discount component. Traders can follow this step-by-step process to interpret rates accurately:
- Identify the current perpetual futures price versus the spot index price on your chosen exchange.
- Calculate the premium index over the funding interval by averaging the price differences.
- Apply the platform-specific funding rate formula, which often includes a clamp or interest rate component to prevent extreme swings.
- Monitor the resulting percentage to gauge market bias and decide on position adjustments.
- Compare the calculated rate against historical averages for the same time of day to spot anomalies.
Understanding these mechanics helps traders avoid common misinterpretations during volatile periods and enables more precise timing for entries and exits.
Historical Cycle Patterns and 2026 Context
Bitcoin funding rates have historically mirrored market cycles with remarkable consistency. During bull runs, sustained positive rates above typical thresholds often precede corrections as leveraged longs become overcrowded. Conversely, deeply negative rates signal capitulation and potential bottoms. In 2026, patterns continue to evolve with increased institutional participation and regulatory clarity that have altered leverage dynamics compared to previous years.
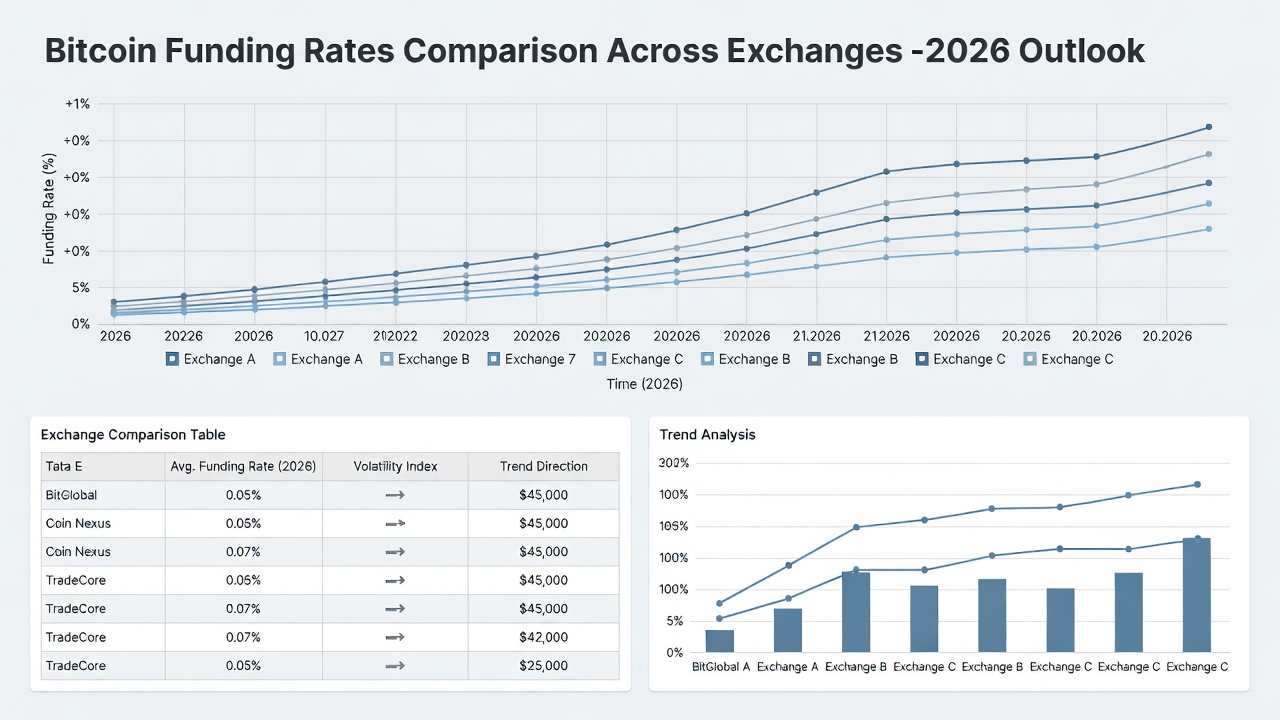
Cross-exchange comparisons reveal divergences that can highlight arbitrage opportunities or localized sentiment. For example, rates on Binance and Deribit frequently align during calm periods but diverge sharply during news events or regional liquidity shifts.
Interpreting Extreme Positive and Negative Values
Extreme positive funding rates typically warn of over-leveraged bullish positions, increasing reversal risk. Negative extremes often mark fear-driven selloffs ripe for rebounds. Traders should combine these signals with volume and open interest data for confirmation rather than acting on rates alone.
Binance and other exchanges publish real-time funding rate dashboards that facilitate this analysis and allow historical comparisons.
Cross-Exchange Comparisons for Better Insights
Funding rates vary across platforms due to differences in user bases, liquidity, and regional factors. Comparing rates on Binance, Bybit, and Deribit can reveal where sentiment is strongest or where arbitrage windows exist. For instance, a persistently higher rate on one exchange may indicate localized retail enthusiasm while another shows more balanced institutional flows. This comparative approach helps traders identify when a move is broad-based versus exchange-specific.
Correlation with On-Chain Metrics Like Exchange Reserves
Funding rates do not exist in isolation. They correlate strongly with on-chain indicators such as Bitcoin exchange reserves. Declining reserves often coincide with positive funding rates as spot buying pressure builds from long-term holders moving assets off exchanges. Rising reserves during negative funding periods may confirm distribution phases where leveraged shorts are building. Monitoring both datasets together strengthens reversal predictions and reduces false signals.
Real-World Case Studies from High-Volatility Events
During the March 2026 volatility spike, funding rates turned sharply negative across exchanges, reaching multi-month lows before a swift recovery. This event demonstrated how extreme negative readings, paired with rising exchange inflows, preceded a short-term bottom that rewarded patient traders. Another case in June 2026 showed prolonged positive rates leading to a meaningful correction after weeks of overcrowding in long positions.
These examples illustrate the importance of waiting for confirmation from multiple indicators rather than reacting to funding rates in isolation.
Practical Trader Checklist for 2026
- Track funding rates across at least three major exchanges daily and note any divergences.
- Cross-reference with on-chain exchange reserve trends and open interest changes.
- Avoid entering positions when rates reach historical extremes without additional confirmation from price action.
- Use funding rate history to size positions conservatively during high-leverage environments.
- Set alerts for rate flips that signal potential sentiment shifts and review them alongside volume profiles.
- Review weekly funding rate averages to understand the broader trend beyond single intervals.
Mistakes to Avoid When Using Funding Rates
Many intermediate traders make the error of treating funding rates as direct price predictors instead of sentiment gauges. Another common pitfall is ignoring the time of day funding occurs, which can lead to misreading temporary spikes. Failing to account for cross-exchange differences or neglecting to combine rates with on-chain data often results in premature trades. Always maintain a multi-indicator approach and keep position sizes appropriate to the overall market context.
FAQ: Common Pitfalls in Funding Rate Analysis
How often should traders check funding rates?
Intermediate traders benefit from checking rates at each funding interval, typically every eight hours, while maintaining awareness of longer-term trends and weekly averages.
Do funding rates predict price direction perfectly?
No. They indicate sentiment and leverage conditions but require combination with other indicators such as volume, open interest, and on-chain metrics for reliable signals.
What platforms offer the best funding rate data?
Established derivatives platforms such as Deribit provide transparent historical data and comparison tools that help traders build robust analysis frameworks.
Can funding rates be used for long-term investment decisions?
Funding rates are primarily short- to medium-term tools. Long-term investors may reference them to understand market extremes but should rely more heavily on fundamental and on-chain analysis for core holdings.
Conclusion
Bitcoin funding rates remain an essential tool for navigating 2026 perpetual futures markets. By mastering their mechanics, historical context, cross-exchange nuances, and correlations with on-chain metrics, traders can identify sentiment shifts and reversal opportunities with greater precision. Consistent application of the checklist, awareness of common mistakes, and integration with broader market data will help intermediate traders turn derivatives information into actionable insights throughout the year and beyond.
No comments yet. Be the first!