 CryptoChain Blog
Introduction to Bitcoin Blockchain Explorers in 2026
New traders entering the Bitcoin market often seek practical ways to understand on-chain data without relying on complex paid platforms. Blockchain explorers provide free, transparent access to the Bitcoin network, allowing users to track transactions, wallet activity, and key metrics that reveal market sentiment. This tutorial focuses on building foundational skills for 2026, emphasizing actionable steps for daily analysis using popular free tools. In a year where Bitcoin adoption continues to grow globally, on-chain analysis helps separate noise from meaningful signals in price action and network health.
By the end of this guide, you will know how to navigate explorers, interpret core metrics, compare tool options, and establish a simple workflow. These habits help identify accumulation patterns and avoid common beginner pitfalls. Understanding the Bitcoin ledger at its base layer builds confidence whether you are holding long-term or making shorter-term decisions.
Selecting the Right Blockchain Explorer Tools
Several free explorers stand out for beginners due to their clean interfaces and comprehensive Bitcoin data. Mempool.space offers real-time visualization of the mempool and fee estimates, making it ideal for seeing pending transactions in action. Blockchair provides advanced search capabilities across multiple chains but shines for Bitcoin address clustering and historical queries. Blockchain.com explorer delivers straightforward transaction lookups with historical charts that are easy to read at a glance.
Start by visiting the homepage of each to familiarize yourself with the layout. For foundational Bitcoin concepts, refer to Bitcoin.org. When comparing, test the same transaction hash across tools to see differences in data presentation. Additional explorers worth exploring include Blockstream.info for its focus on raw block data and mempool visualization. Each platform updates in real time, so cross-verification reduces the chance of misreading a temporary glitch or delayed indexing.
Core Metrics Every Beginner Should Master
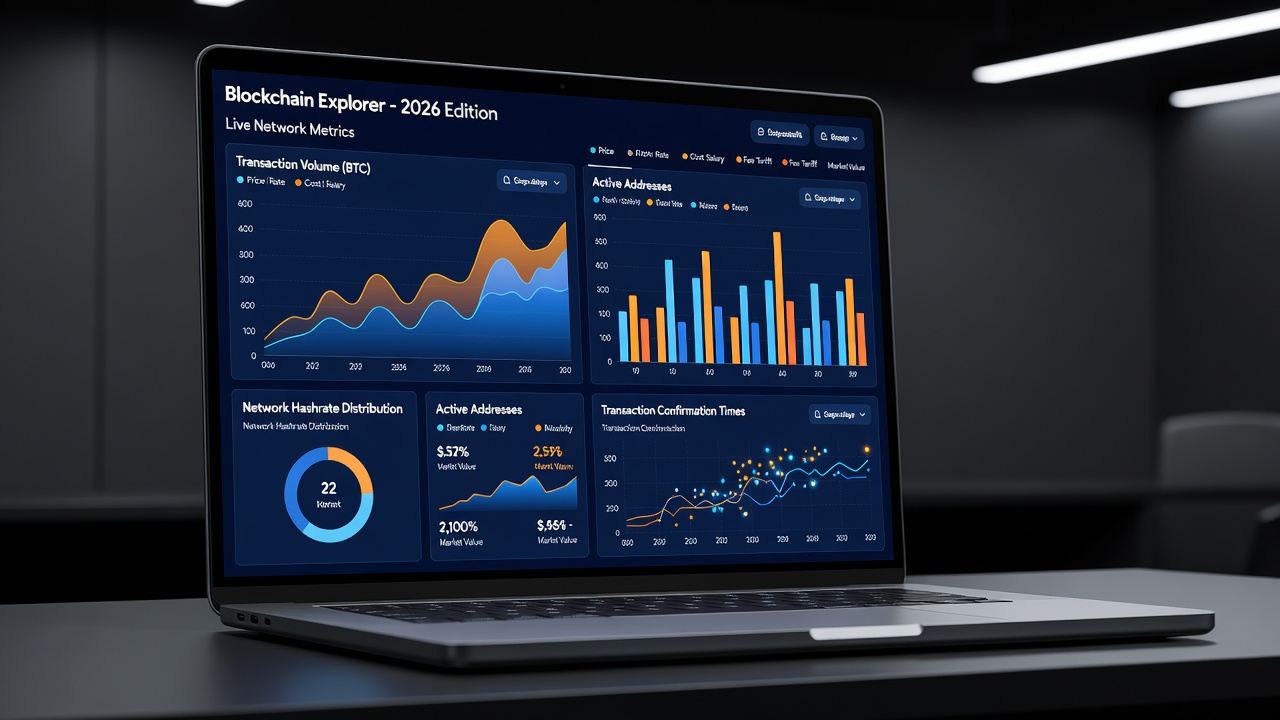
Understanding key metrics forms the basis of on-chain analysis. Transaction volume measures the total BTC moved on-chain daily, indicating network activity levels. Spikes often correlate with major market events such as ETF inflows or regulatory announcements. Tracking volume over weeks reveals whether activity is organic or driven by a few large transfers.
Active addresses track unique wallets sending or receiving BTC within a period. Rising active addresses during price dips can signal growing participation from new users or institutions. Realized price calculates the average acquisition cost of all coins based on their last on-chain movement, offering insight into holder profitability and potential support levels. When realized price sits below the current spot price, many holders are in profit, which can influence selling pressure.
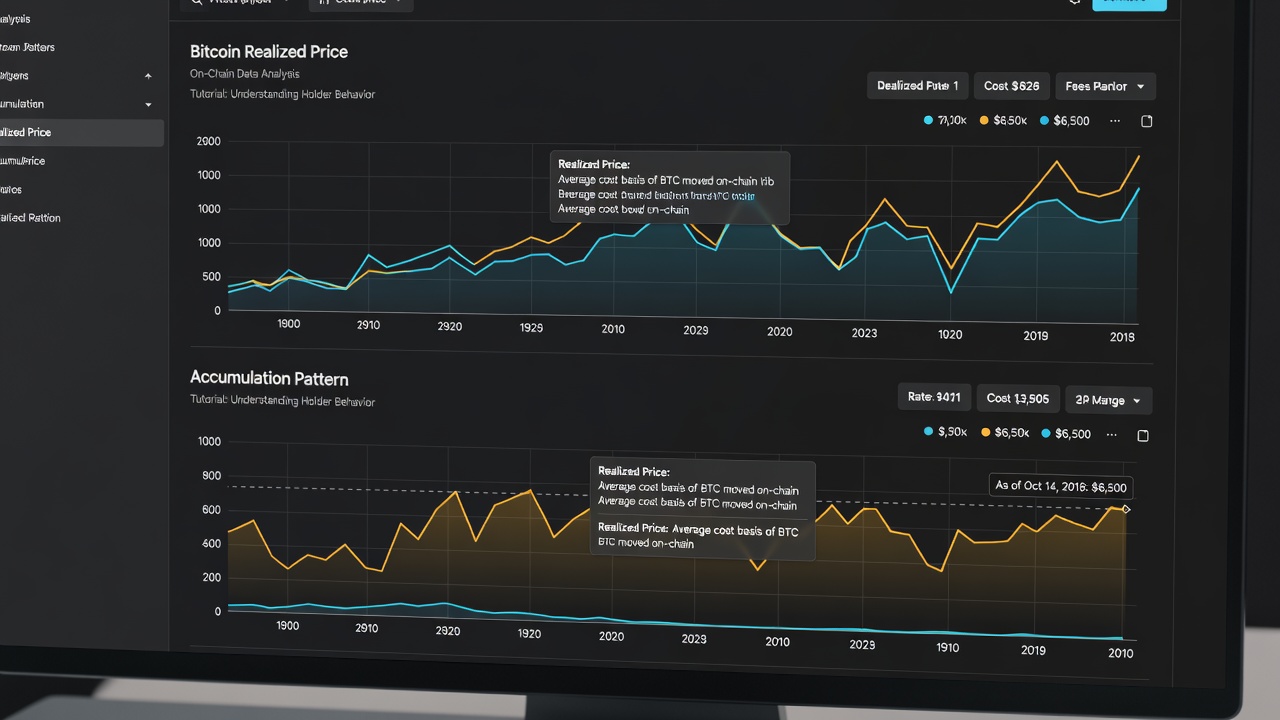
These metrics together help spot accumulation when active addresses increase while realized price remains stable relative to spot price. Beginners should avoid treating any single number in isolation; instead, look for convergence across multiple indicators for higher-confidence observations.
Step-by-Step Navigation of Popular Explorers
- Enter a known Bitcoin address or transaction ID into the search bar on mempool.space and note the confirmation status and fee rate.
- Review the transaction volume chart on the dashboard to identify daily trends over the past month and compare against recent price movements.
- Navigate to the addresses section on Blockchair to filter for high-activity wallets and examine their age and balance distribution.
- Cross-reference realized price data if available in the metrics overview, then export a small CSV sample for personal tracking if the tool allows.
- Repeat the process on a second explorer to confirm consistency before drawing conclusions.
Repeat this process daily to build pattern recognition. Real examples include monitoring addresses associated with major exchanges during volatility periods, where sudden outflows can precede price shifts. Always verify the address label if the explorer provides one to avoid confusing exchange hot wallets with individual holders.
Comparing Explorer Features for Beginners
- Ease of Use: Mempool.space leads with visual graphs ideal for quick scans and mobile-friendly layouts.
- Depth of Data: Blockchair excels at clustering analysis without requiring advanced knowledge, allowing users to group related addresses.
- Speed: Blockchain.com loads fastest for simple lookups but offers fewer custom filters than its competitors.
- Additional Context: Some tools include fee market heatmaps that help interpret network congestion alongside volume metrics.
Choose based on your primary need: visualization versus search flexibility. No single tool covers everything perfectly, so using two in tandem provides the most reliable insights. For users focused purely on Bitcoin, starting with mempool.space and Blockchair covers 90 percent of beginner requirements.
Simple Daily Workflow for On-Chain Checks
Establish a 10-minute routine: Check transaction volume first thing in the morning using the previous 24-hour window, note active address changes mid-day, and review realized price before market close. Log observations in a notebook or spreadsheet to track patterns over weeks. Include columns for date, volume change, active address delta, and any notable address clusters observed.
This habit reveals accumulation when volume rises alongside steady active addresses and realized price holding firm. Over time, you will recognize seasonal patterns, such as lower weekend activity or spikes around known halving anniversaries. Consistency matters more than perfection; even brief daily reviews compound into strong intuition after several months.
Spotting Accumulation Patterns with Real Examples
Accumulation often appears as increasing active addresses during sideways price action. In early 2026 scenarios, explorers showed clusters of new addresses accumulating BTC below realized price levels while transaction volume remained moderate. Cross-check multiple metrics to confirm rather than relying on one signal. For instance, if active addresses rise but volume stays flat, it may indicate small retail entries rather than large institutional accumulation.
Another practical example involves watching exchange reserve addresses. When coins move from exchange cold wallets to unknown addresses in batches, explorers can flag the activity. Combine this with realized price stability to build a clearer picture of holder conviction.
FAQ: Common Beginner Mistakes to Avoid
What is the biggest error new users make with explorers?
Overlooking context by focusing solely on one metric without comparing across tools or timeframes, leading to false signals.
How often should I check these metrics?
Daily checks suffice for beginners; avoid constant monitoring that leads to emotional decisions based on short-term noise.
Can explorers predict price movements?
They provide supporting data only—combine with broader market awareness for better results rather than treating them as crystal balls.
Should I pay for premium explorer features as a beginner?
Free tiers of the tools mentioned cover all essential metrics; upgrade only after you outgrow the basic dashboards.
Conclusion
Mastering Bitcoin blockchain explorers equips beginners with transparent, free analysis tools essential for 2026 trading. By focusing on transaction volume, active addresses, and realized price through consistent workflows, you develop skills that support informed decisions. Start today with the steps outlined and refine your approach as patterns emerge over repeated practice.

No comments yet. Be the first!