 CryptoChain Blog
Understanding Funding Rate Divergences in Bitcoin Markets
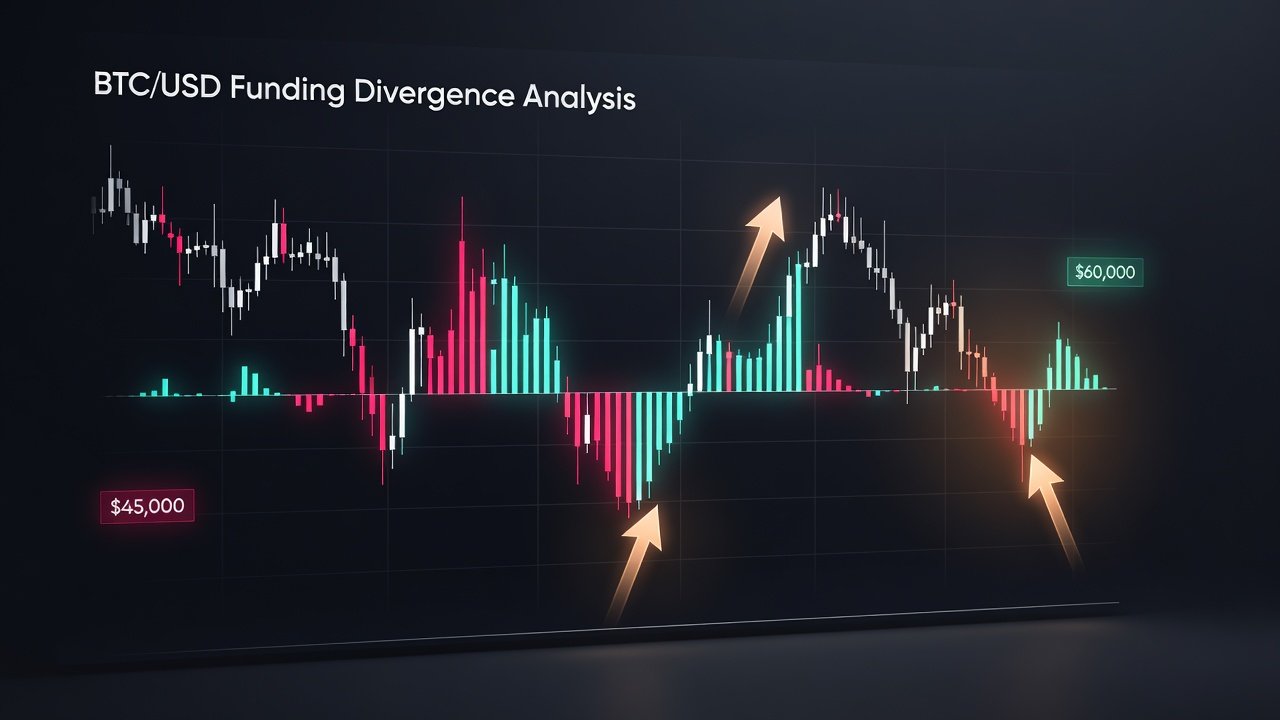
Funding rate divergences occur when perpetual futures funding rates move opposite to spot price action, often signaling exhaustion or impending reversals. In Bitcoin trading, positive funding rates indicate longs paying shorts during bullish sentiment, while negative rates show the reverse. When price pushes higher but funding rates flatten or drop, divergence hints at weakening momentum. This dynamic has proven reliable across multiple cycles and forms the core of reversal playbooks for 2026. Traders who master these signals can position ahead of major moves rather than chasing them after confirmation on the chart.
Mechanics Behind Divergences Between Funding Rates and Price Action
Perpetual swap contracts use funding rates to keep prices anchored to spot. Rates are calculated every eight hours on most platforms and reflect the balance between long and short positions. Divergence arises when aggressive spot buying fails to attract corresponding futures leverage, or vice versa. Traders monitor the funding rate histogram alongside price candles; a divergence appears as price making higher highs while the funding rate prints lower highs. This mismatch often precedes corrections because leveraged positions become vulnerable to liquidations once sentiment shifts. The funding rate itself is derived from the premium or discount of the perpetual contract relative to the spot index price, adjusted by a multiplier that varies by exchange. When this premium grows without corresponding spot demand, the divergence becomes pronounced and statistically more likely to resolve through price retracement.
Key Components to Track
- Funding rate values and their 7-day moving average to smooth noise
- Price action on higher timeframes such as 4H and daily for structural context
- Open interest changes to confirm whether leverage is building or unwinding
- On-chain metrics like exchange inflows and active address counts for additional context
- Volatility indicators such as the 14-day ATR to gauge potential reversal magnitude
Historical Case Studies: 2021–2025 Bitcoin Cycles
In late 2021, Bitcoin price rallied above $60,000 while funding rates on major exchanges turned negative on multiple occasions, foreshadowing the macro top. The divergence lasted nearly two weeks before a cascade of long liquidations accelerated the decline. During the 2022 bear market, positive funding spikes during relief rallies consistently marked local tops before deeper declines, with one notable instance in March where funding peaked above 0.05% while price failed to sustain above $45,000. By 2024, similar patterns emerged during the post-halving recovery, where funding rate compression preceded sharp pullbacks in March and August. In March 2024, price advanced on spot demand while average funding rates remained near zero, resulting in a 12% correction over ten days. In 2025, divergences appeared ahead of the summer consolidation, with price advancing on low funding before a reversal triggered by rising exchange reserves and a sudden funding flip. These examples illustrate how divergences act as early warning signals rather than precise timing tools, often providing a window of several days for preparation.
Step-by-Step Monitoring Using Free Tools
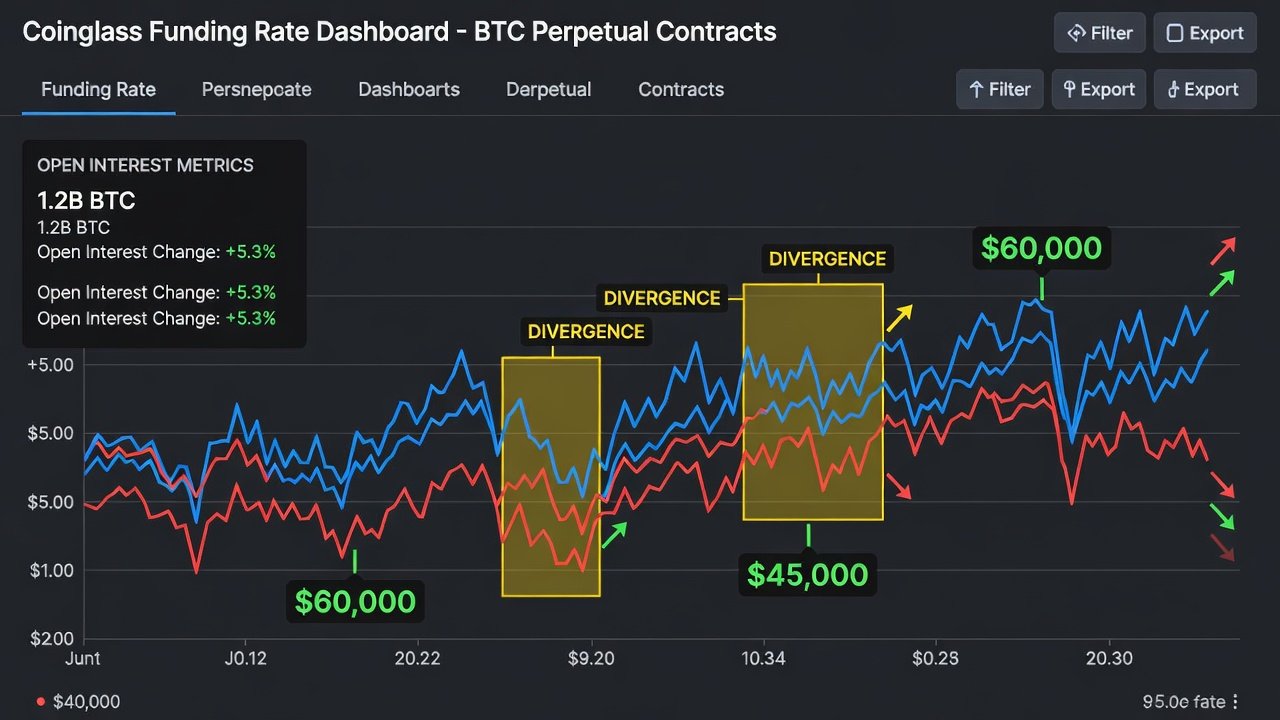
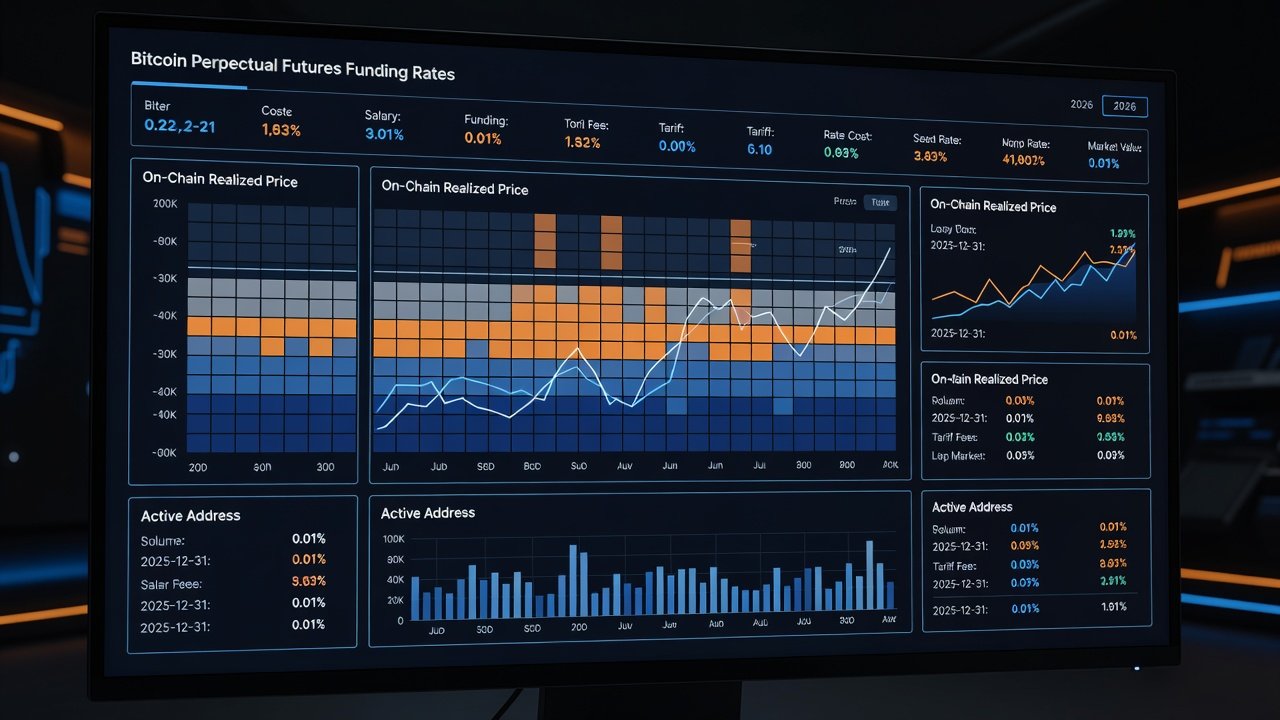
Coinglass provides real-time funding rate data across exchanges with customizable charts for Bitcoin perpetuals. Users can overlay funding rates on price and filter by exchange to spot aggregate divergences. Coinglass also displays open interest heatmaps that highlight leverage clusters and historical extremes. Glassnode offers on-chain dashboards including exchange flows and realized price metrics that complement funding data. Glassnode studio allows creation of custom alerts when funding rates diverge from price velocity, and users can combine these with realized cap metrics for deeper insight. Additional free resources include TradingView public scripts that plot funding rate oscillators directly on price charts.
Practical workflow: First load the Bitcoin perpetual funding rate chart on Coinglass. Add the price overlay and note any 48-hour periods where price trends up but average funding declines. Cross-reference open interest; rising OI with falling funding strengthens the divergence signal. Then check Glassnode for exchange inflow spikes that often accompany reversal setups. Set alerts for funding rate moving averages crossing key thresholds such as zero or the 30-day mean. Review historical divergence instances on the platform to calibrate personal risk parameters before applying the strategy in live markets.
Integrating Open Interest and On-Chain Metrics
Funding rate divergences gain conviction when paired with open interest contraction or expansion. A bullish price move accompanied by declining open interest and negative funding often signals distribution rather than accumulation. On-chain confirmation includes rising exchange deposits and falling active addresses, indicating reduced network demand. Combining these layers reduces false signals common in isolated funding data. For instance, in the 2024 August reversal, open interest dropped 18% while price made marginal highs and funding rates compressed, providing a multi-factor confirmation that improved entry timing. Traders should also monitor the ratio of long to short positions on derivatives platforms to see whether the divergence aligns with crowded positioning.
Checklist for Spotting High-Probability Reversal Setups in 2026
- Confirm price makes a higher high on the daily chart while 8-hour funding rate average trends lower for at least three periods.
- Verify open interest is not expanding proportionally to price gains; ideally it should be flat or contracting.
- Check Glassnode for exchange inflows exceeding the 30-day average by at least 15%.
- Wait for a funding rate flip below zero or a sharp spike in volatility measured by ATR expansion.
- Enter only after a 4H candle close confirms the reversal direction with volume support above the session average.
- Place stops beyond the recent swing high or low to account for wick liquidity and typical noise.
- Target initial profit at the previous swing low or the nearest major support level identified on the daily chart.
Common Pitfalls and FAQ for Intermediate Traders
How reliable are funding rate divergences in low-volume periods?
They become less reliable during holiday weekends or low-liquidity sessions when single large orders distort rates. Always cross-check with 24-hour volume filters and avoid trading during major news events without additional confirmation.
Should traders use multiple exchanges or aggregate data?
Aggregate views from Coinglass reduce noise from isolated platform anomalies. Focus on the top five exchanges by volume for the cleanest signals while still monitoring individual venue extremes that may lead broader moves.
What timeframes work best for 2026 signals?
Daily and 4H charts provide the clearest divergences, while 1H data helps fine-tune entries once the higher-timeframe setup appears. Weekly charts can offer macro context but rarely produce actionable divergences on their own.
Can divergences appear during strong trends without reversing?
Yes, especially in parabolic moves. Treat them as caution flags rather than automatic reversal triggers and require on-chain or open interest confirmation before acting.
How should position sizing be handled around these setups?
Reduce position size by 30-50% compared to trend-following trades because divergences carry higher uncertainty. Use defined risk per trade and avoid pyramiding until the reversal is confirmed by price structure.
Conclusion
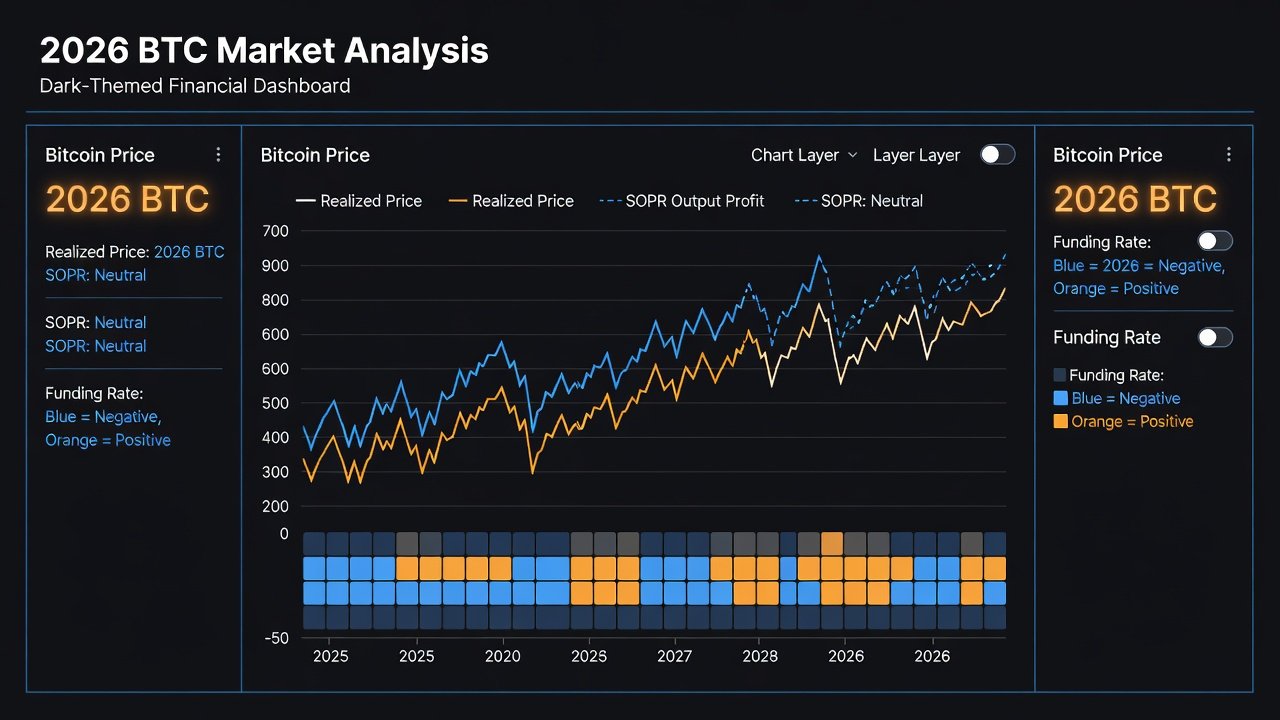
Bitcoin funding rate divergences offer a structured lens for anticipating 2026 reversals when combined with open interest and on-chain data. By following the monitoring steps and checklist above, intermediate traders can develop repeatable processes that improve decision quality across market regimes. Consistent application over multiple cycles builds the edge necessary for sustained performance in volatile Bitcoin markets.
No comments yet. Be the first!