 CryptoChain Blog
Introduction to Bitcoin Reversal Signals in 2026
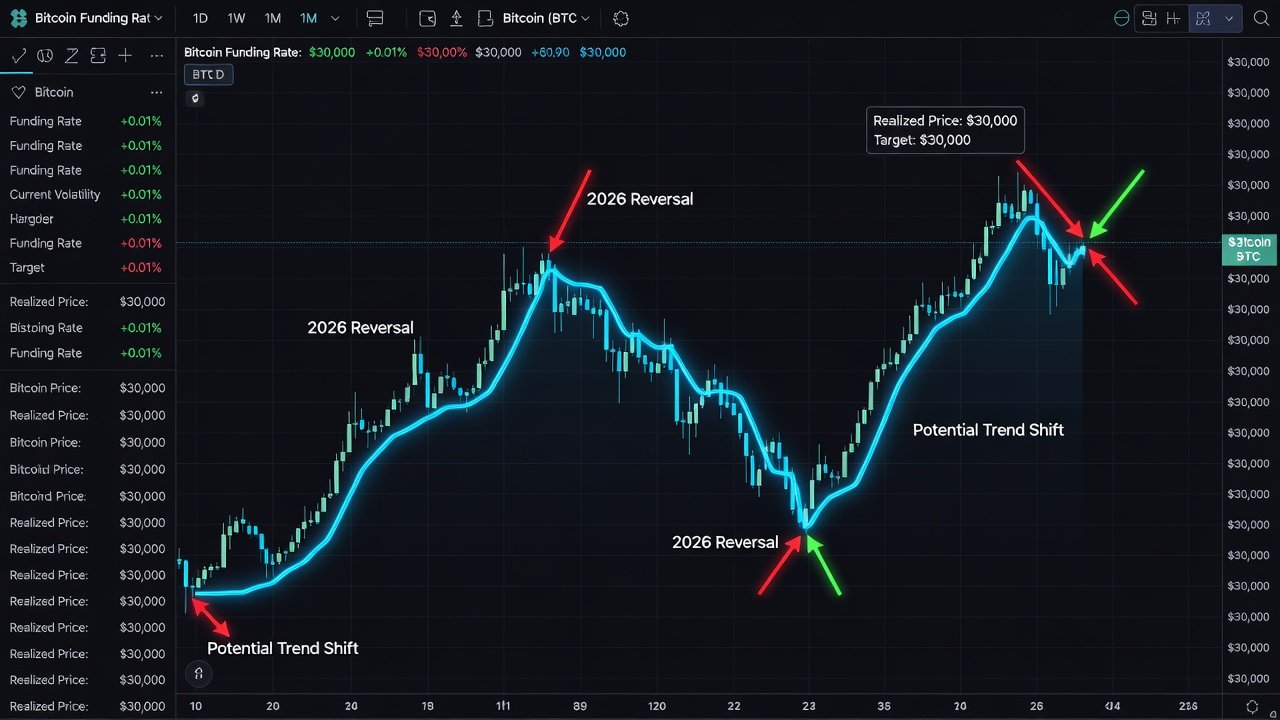
Traders seeking an edge in volatile markets often turn to on-chain metrics like funding rates and realized price. These tools help identify potential reversals by highlighting when sentiment diverges from underlying value. In 2026, combining them offers a practical framework for timing entries and exits amid evolving market cycles. As Bitcoin continues to mature with institutional involvement and regulatory shifts, these signals become even more critical for navigating uncertain price action. This approach moves beyond simple price charts to incorporate derivatives data and holder behavior, providing a multi-layered view that has proven effective in prior cycles.
Funding rates reflect perpetual futures trader sentiment, while realized price shows the average cost basis of Bitcoin holders. When these signals diverge, reversals become more probable. This guide covers calculations, confirmations, case studies from 2021-2025, and actionable 2026 strategies. By the end, readers will have concrete methods to apply these concepts in real-time trading environments.
Understanding Funding Rates Calculation
Funding rates are periodic payments between long and short positions in perpetual contracts. Positive rates indicate longs pay shorts, signaling bullish leverage. Negative rates show the opposite. To calculate, traders reference exchange data where rates are typically expressed as a percentage over 8-hour periods. The formula involves the difference between the perpetual contract price and the spot price, adjusted by a multiplier based on open interest. For instance, if the contract trades at a premium, longs pay shorts to balance the market.
High positive funding often precedes tops as excessive optimism builds. For 2026 applications, monitor when rates spike above historical averages during price rallies. Compare across exchanges like Binance and Bybit to spot consensus sentiment. Divergences between platforms can also indicate arbitrage opportunities or localized manipulation risks. Traders should track the 24-hour average funding rate to smooth out short-term noise and focus on sustained trends that align with on-chain movements.
Realized Price Explained
Realized price aggregates the on-chain cost basis by valuing each Bitcoin at its last moved price. It acts as dynamic support or resistance. When spot price trades far above realized price, euphoria may signal tops; below suggests capitulation bottoms. This metric differs from market price because it weights coins by their actual transaction history rather than current trading activity. Calculation involves dividing the realized capitalization, which sums the value of all coins at their last transfer price, by the total supply in circulation.
In practice, realized price serves as a psychological anchor for long-term holders. During 2026 bull runs, price staying well above this level while funding rates remain elevated could warn of overextension. Conversely, price testing realized price from above with negative funding creates high-probability bounce setups. Analysts often overlay moving averages on realized price for additional context, such as 30-day or 90-day variants to identify short-term versus long-term holder behavior.
Combining the Signals for Reversal Detection
The power emerges from divergence. Bullish reversal setups occur when funding rates turn deeply negative while price holds above realized price. Bearish setups show high positive funding with price below realized price. This combination filters out false signals that single metrics might generate. For example, negative funding alone could reflect temporary deleveraging, but when paired with price above realized price, it suggests smart money accumulation amid retail fear.
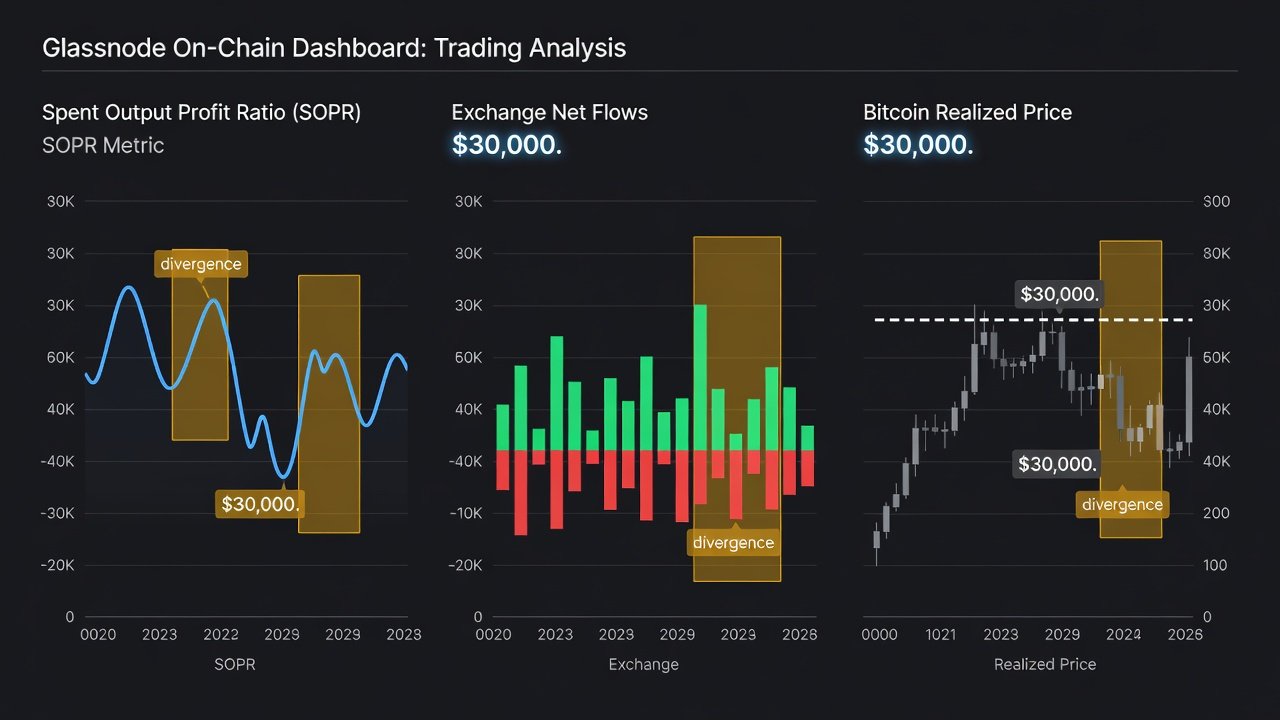
Confirmation comes via SOPR (Spent Output Profit Ratio) and exchange flows. Rising SOPR above 1 during negative funding strengthens buy signals. Net exchange inflows during positive funding warn of distribution. SOPR measures the profit or loss realized by spent outputs, with values over 1 indicating profitable selling. Exchange flows track net movements to and from custodial wallets, where large inflows often precede sell pressure. In 2026, integrating these with funding and realized price creates a robust confirmation stack that reduces whipsaw trades.
Historical Case Studies 2021-2025
In 2021, negative funding with price near realized price preceded the summer rally after the May crash. Funding rates dropped below -0.05% while realized price acted as support around $30,000 levels, leading to a strong recovery. By late 2022, positive funding divergence flagged the bear market bottom as rates turned negative amid price compression near realized price, coinciding with capitulation events. 2023-2024 showed multiple instances where SOPR confirmation improved accuracy, such as the March 2024 halving period where funding spikes were tempered by stable realized price readings. These patterns provide templates for 2026 trading, highlighting how similar setups repeated across different macro environments including interest rate changes and ETF inflows.
Comparing cycles reveals that 2021 featured faster reversals due to retail dominance, while 2024-2025 incorporated more institutional flows that extended divergence periods. Traders can backtest these on historical data to calibrate thresholds for the current cycle, adjusting for increased market maturity in 2026.
Free Dashboard Setups
Access Glassnode for realized price and SOPR charts. Set alerts for realized price crossovers and SOPR spikes. Customize dashboards to display 7-day and 30-day averages alongside funding overlays where available. On Coinglass, track funding rates across major exchanges with customizable views, heatmaps, and historical comparisons. Users can create free accounts to save multiple workspaces, one for long setups and another for shorts. Combine both platforms for a complete workflow without paid subscriptions by exporting data into spreadsheets for correlation analysis. Regular monitoring involves checking daily funding averages and weekly realized price updates to align with trading timeframes.
Step-by-Step Entry and Exit Rules
- Identify divergence between funding rates and realized price on daily timeframes.
- Confirm with SOPR above 1 and neutral or outflowing exchange flows over the past week.
- Enter long on negative funding at realized price support with stop below recent swing lows or 5% below entry.
- Scale in over 2-3 days to average into the position during confirmation.
- Exit when funding turns positive and price exceeds realized price by a significant margin, or use trailing stops tied to realized price bands.
- For shorts, reverse the conditions with positive funding and price below realized price as the core setup.
These rules emphasize patience, waiting for full alignment rather than acting on partial signals. Backtesting on 2023-2025 data shows improved win rates when all confirmations are present.
Risk Management Tips
- Position size at 1-2% of portfolio per trade to withstand volatility spikes common in reversal periods.
- Use trailing stops based on realized price levels or ATR multiples for dynamic protection.
- Avoid trading when signals conflict without additional confirmation from volume or broader market indices.
- Review weekly on-chain updates to adjust thresholds as market liquidity evolves in 2026.
- Maintain a trading journal logging each divergence setup, outcome, and lessons learned to refine the strategy over time.
FAQ on Common Pitfalls
What if signals conflict?
Wait for alignment or add volume analysis before acting. Conflicting data often leads to whipsaws in 2026's choppy conditions influenced by macroeconomic events.
Are these metrics reliable alone?
No. Always layer with exchange flows and broader market context for better results, as isolated signals have shown higher failure rates in historical reviews.
How often should dashboards be checked?
Daily for funding rates and weekly for realized price to balance responsiveness with noise reduction, while setting automated alerts for key thresholds.
Can this work in sideways markets?
Divergences are less frequent in ranges but provide high-conviction breaks when they occur; combine with trend filters like moving averages for better filtering.
Conclusion
Mastering funding rates combined with realized price equips traders for informed 2026 decisions. By following the outlined steps and confirmations, participants can navigate reversals with greater precision and disciplined risk controls. Continuous refinement through historical study and live application will enhance effectiveness as the market landscape shifts.
No comments yet. Be the first!