 CryptoChain Blog

Introduction to Bitcoin Reversal Signals in 2026
Traders seeking reliable Bitcoin reversal signals in 2026 often turn to on-chain and derivatives metrics. Combining perpetual futures funding rate extremes with realized price divergences creates a robust framework for identifying potential market turns. This approach leverages market sentiment from leveraged trading alongside fundamental cost-basis data from the blockchain. In an environment of maturing institutional participation and evolving leverage dynamics, these signals gain additional relevance. Understanding both metrics individually and then integrating them provides traders with a layered view that single indicators cannot match. This guide explores their mechanics in detail, reviews historical patterns across multiple cycles, incorporates confirmation through SOPR and exchange flows, and delivers practical step-by-step workflows using popular platforms.
Understanding Perpetual Futures Funding Rates
Perpetual futures contracts lack an expiration date and use funding rates to keep prices aligned with spot markets. Positive rates indicate longs pay shorts, signaling bullish leverage. Negative rates show shorts paying longs, often during bearish sentiment. Extreme readings—above 0.1% or below -0.05% daily on major exchanges—highlight overcrowded positions prone to liquidation cascades. Funding rates are calculated as the difference between perpetual contract prices and spot prices, adjusted by a multiplier that varies by exchange. On platforms like Binance and Bybit, payments occur every eight hours, creating predictable pressure points. When funding remains persistently positive over several periods, it builds a crowded long bias that can unwind rapidly if price action stalls. Conversely, sustained negative funding encourages short covering rallies. In 2026, monitoring aggregated rates across venues provides a clearer picture of market leverage than single-exchange data because liquidity has fragmented across more derivatives platforms. Traders should also consider open interest trends alongside funding to gauge whether extremes reflect genuine conviction or thin positioning.
Realized Price and Its Role in Divergences
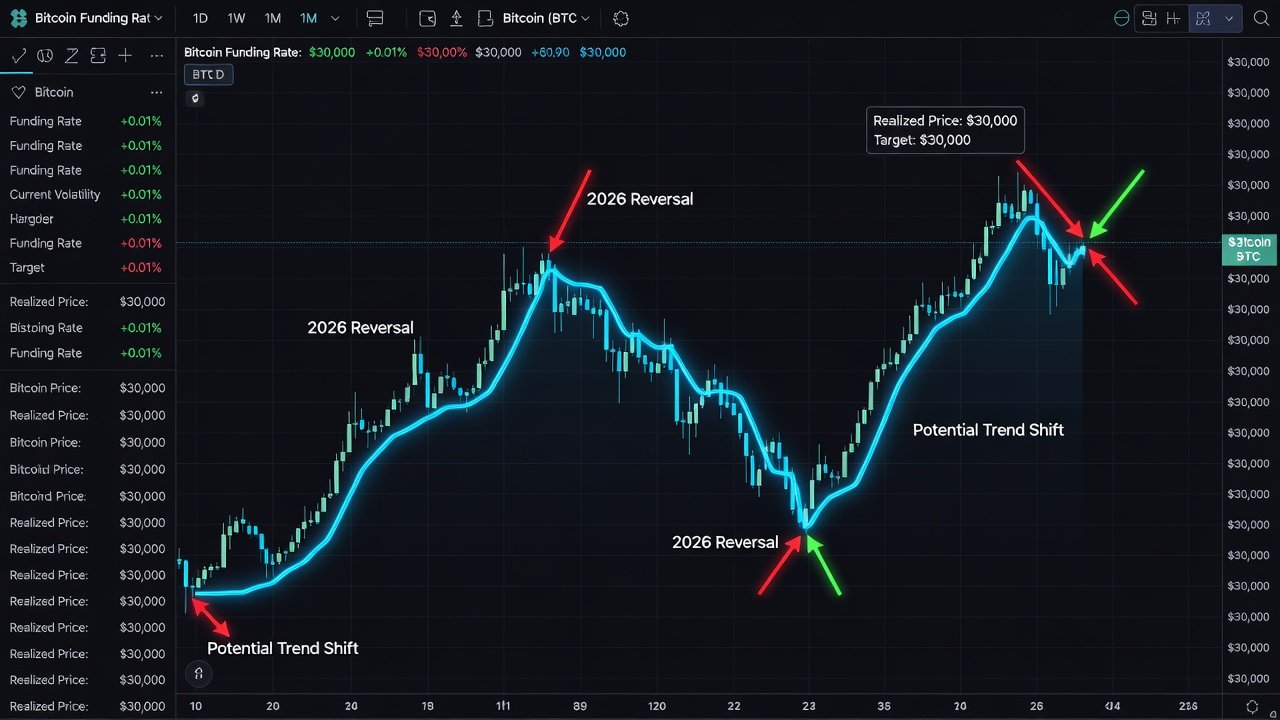
Realized price calculates the volume-weighted average price at which coins last moved on-chain. It serves as a dynamic support or resistance level representing the collective cost basis. When spot price trades significantly above realized price during positive funding extremes, it signals potential overheating. Conversely, price below realized price amid negative funding suggests capitulation bottoms. Divergences occur when price and realized price move in opposite directions to funding rate trends. For example, rising prices with contracting realized price and spiking positive funding often mark local tops. The metric updates continuously as coins transfer between wallets, making it sensitive to distribution phases. During bull markets, realized price climbs steadily as new buyers enter at higher levels, but sharp divergences from spot price combined with funding data can warn of exhaustion before visible price reversals appear.
Historical Patterns from Prior Cycles
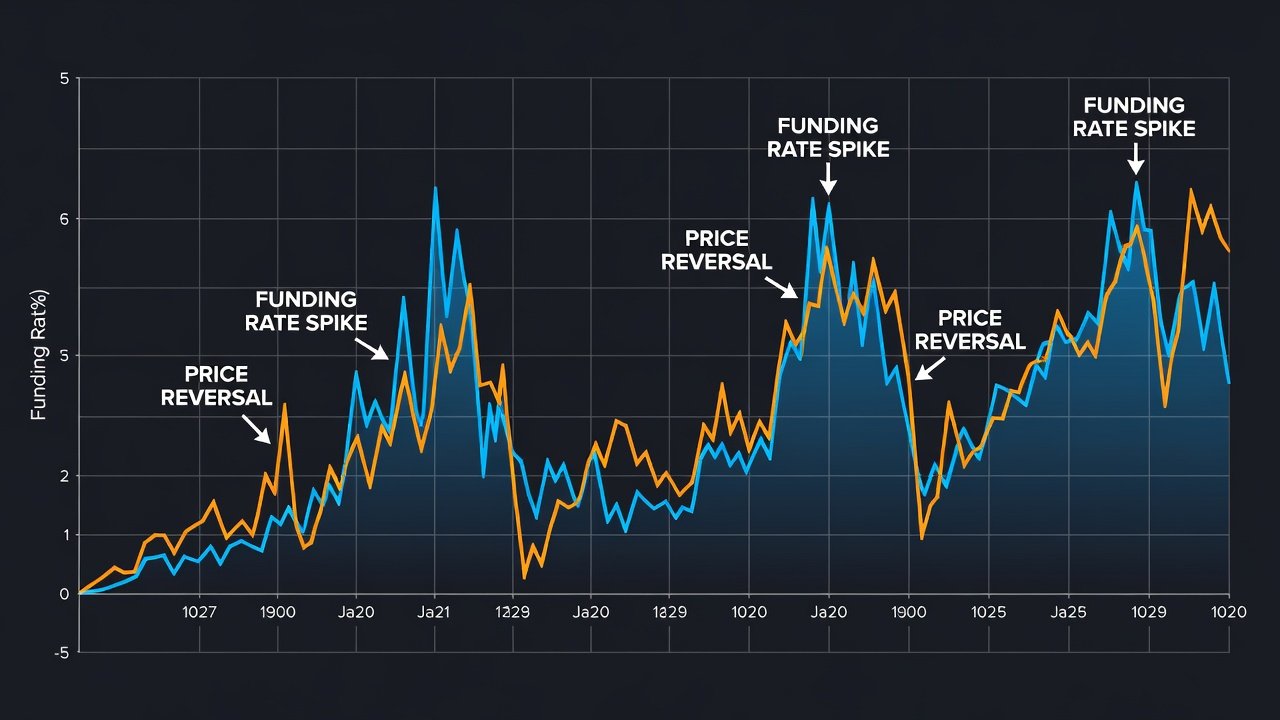
Analysis of 2017, 2021, and 2024-2025 cycles reveals recurring setups. In late 2021, funding rates exceeded 0.15% daily while price outpaced realized price by over 50%, preceding a major correction. Similar patterns appeared in 2017 when negative funding coincided with price testing realized price from below, marking cycle lows. The 2024-2025 period showed funding spikes near cycle highs followed by realized price catch-up during corrections. These precedents suggest 2026 setups will follow comparable dynamics as leverage and on-chain behavior mature. Key lessons include the importance of waiting for multiple confirming signals rather than acting on funding alone, and recognizing that extreme readings can persist longer in bull markets before reversing. Cycle comparisons also highlight how realized price tends to act as stronger support in later stages of adoption when holder bases broaden.
Confirmation with SOPR and Exchange Flows
Spent Output Profit Ratio (SOPR) measures whether coins are sold at profit or loss. SOPR above 1 during funding extremes confirms euphoria, while values below 1 near realized price support add conviction to bottoms. Exchange flows provide additional context: large inflows during positive funding often precede sell-offs, while outflows amid negative funding indicate accumulation. Combining these with funding and realized price creates a multi-layered signal. A setup with extreme positive funding, price far above realized price, SOPR >1.2, and rising exchange inflows warrants caution for longs. SOPR can be viewed on different timeframes, with short-term SOPR capturing day-to-day sentiment and longer-term versions revealing structural shifts. Exchange flow data benefits from filtering out known exchange wallets to reduce noise. When all elements align, the probability of a meaningful reversal increases substantially compared to isolated metric readings.
Step-by-Step Monitoring Workflow
- Track aggregated funding rates on Coinglass for Bitcoin perpetuals across Binance, Bybit, and OKX, focusing on 24-hour and 7-day averages.
- Monitor realized price and SOPR on Glassnode dashboards, setting custom alerts for deviations beyond two standard deviations from recent means.
- Set alerts for funding above 0.08% or below -0.04% daily averages while cross-checking open interest changes.
- Cross-reference with 7-day exchange net flows and SOPR moving averages to filter low-conviction signals.
- Validate divergences by comparing current price to realized price ratios and noting any acceleration in either direction.
- Review weekly summaries to identify building setups rather than reacting to intraday noise.
Real Entry and Exit Examples
Consider a hypothetical 2026 scenario: funding spikes to 0.12% while price trades 40% above realized price. SOPR reaches 1.3 and exchange inflows accelerate over three consecutive days. Traders might reduce long exposure by 30-50% or initiate shorts with stops above recent swing highs and targets near the realized price level. Position sizing should remain modest given the leveraged nature of the setup. Conversely, funding at -0.06%, price testing realized price from above, SOPR at 0.85, and sustained net outflows could trigger scaled long entries. Initial targets might sit at prior realized price resistance, with additional scaling if funding normalizes and SOPR crosses back above 1. A third example involves mixed signals where funding normalizes quickly while realized price divergence persists; in such cases, traders wait for full alignment before committing capital.
Free Dashboard Setups
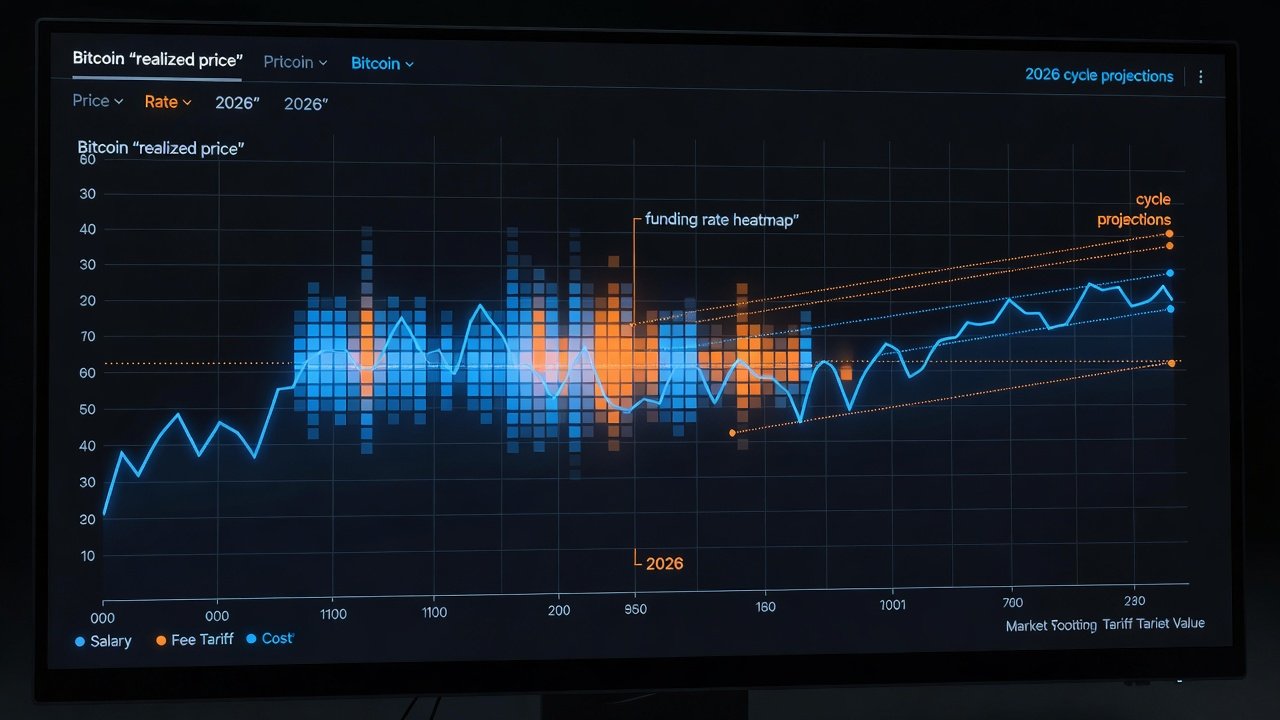
Users can build custom views on Glassnode by combining the realized price metric with SOPR and exchange reserves, then exporting data for overlay on external charting tools. Coinglass offers free funding rate heatmaps and historical charts that can be bookmarked for daily review. Overlay these on TradingView for visual divergence detection using simple moving averages. Regular weekly reviews of these dashboards help maintain discipline and catch developing setups early. Advanced users can combine API feeds from both platforms into personal spreadsheets for automated ratio calculations between funding and realized price deviation.
Risk Management Essentials
Always size positions conservatively when acting on these signals. Use stop-losses beyond key realized price levels and avoid leverage exceeding 3x during extreme readings. Diversify confirmation across multiple metrics to reduce false positives. Track position correlation with broader market volatility and maintain a journal of signal outcomes for continuous improvement. Consider scaling out of positions in tranches rather than all at once. Account for potential delays between signal formation and actual price reaction, which can last several days in 2026's more liquid environment.
Common Interpretation Mistakes to Avoid
- Ignoring multi-exchange funding aggregation, leading to skewed sentiment views that miss broader market leverage.
- Treating realized price as a static line rather than a dynamic average that shifts with on-chain activity.
- Overlooking SOPR context during low-volume periods when small transfers distort readings.
- Entering trades solely on one metric without flow confirmation, increasing exposure to whipsaws.
- Neglecting macroeconomic factors that can override on-chain signals during major news events.
- Failing to adjust thresholds as market maturity changes average funding levels over time.
Conclusion
Mastering the combination of funding rate extremes and realized price divergences equips traders with high-conviction Bitcoin signals for 2026. Through disciplined monitoring, confirmation layers, and sound risk practices, market participants can navigate volatility with greater confidence. Consistent application of these methods builds a repeatable edge in evolving crypto markets while emphasizing patience and multi-metric validation over reactive trading.
No comments yet. Be the first!