 CryptoChain Blog
Introduction to Bitcoin Realized Price in 2026
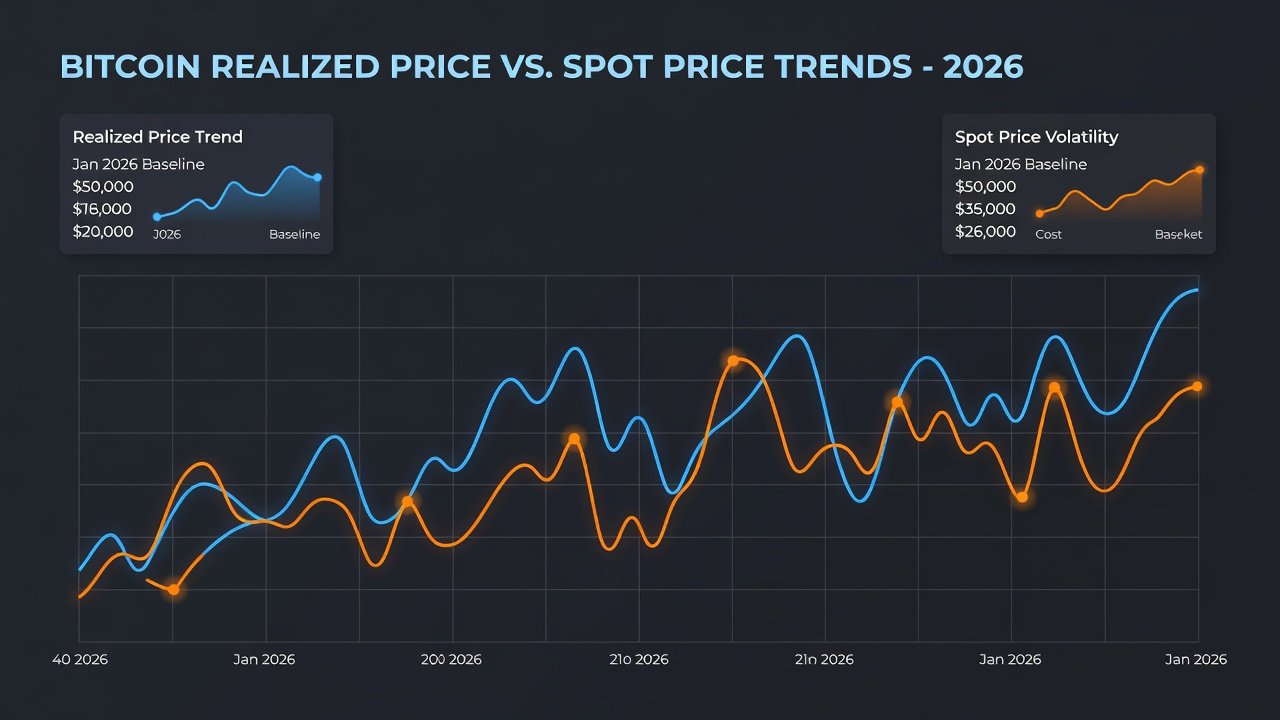
Bitcoin realized price serves as a critical on-chain metric that reflects the average cost basis of all coins in circulation, weighted by their last movement. In 2026, this indicator continues to provide traders and investors with valuable insights into holder behavior, potential support zones, and overall market sentiment. Unlike spot price, which fluctuates with real-time trading, realized price offers a more stable view of underlying holder economics across bull and bear phases. This comprehensive guide explores calculation methods, historical patterns during cycles, integration with other on-chain data, and practical applications for decision making. Readers will find detailed examples of using realized price for entry and exit strategies, visualizations of 2026 trends, and case studies drawn from past market phases. Additional sections cover limitations, combinations with funding rates and volatility tools, plus a step-by-step tutorial for building custom dashboards.
How Realized Price Is Calculated
The realized price aggregates the price at which each Bitcoin was last transacted on-chain, divided by the total supply. This method accounts for lost coins and dormant holdings by using the most recent on-chain movement as the basis. Analysts often reference tools from providers like Glassnode to access these metrics directly. To compute it manually, one sums the USD value of every UTXO at its last spend price and divides by circulating supply. Adjustments for lost coins occur naturally since unmoved UTXOs retain their original realization price. In practice, platforms automate this process with daily updates that incorporate new blocks and transactions. Understanding the formula helps traders avoid misinterpreting short-term noise versus structural shifts in holder cost basis.
Realized Price Versus Spot Price Comparison
Spot price represents the current market value driven by buy and sell orders, while realized price indicates the collective entry point of holders. When spot price trades above realized price, it typically signals unrealized profits across the network, fostering bullish sentiment. Conversely, periods where spot falls below realized price highlight potential capitulation zones where weak hands may exit. In 2026 trends, this divergence helps identify accumulation phases where long-term holders maintain positions despite volatility. The gap between the two metrics also reveals leverage levels and speculative fervor, offering early warnings before major reversals. Traders monitor the ratio of spot to realized price to gauge euphoria or fear levels in real time.
Historical Patterns Across Market Cycles
During previous bull runs, realized price acted as dynamic support as new capital entered at higher levels. Bear markets saw realized price flatten while spot price dipped below it, marking capitulation. Case studies from 2018 and 2022 demonstrate how realized price floors preceded recoveries, guiding holders through emotional market swings. In the 2017-2018 cycle, realized price remained steady around key levels even as spot crashed over 80 percent, creating a clear support zone for patient buyers. The 2022 bear phase showed similar behavior with realized price providing a psychological floor amid macroeconomic pressures. These patterns repeat with variations, influenced by institutional adoption and macroeconomic factors. 2026 data continues this legacy, showing how realized price clusters often align with long-term holder accumulation periods.
2026 Holder Insights and Trend Visualizations
Current 2026 data shows realized price providing context for holder cost basis amid evolving market conditions. Visual analysis reveals clusters of activity around key levels, highlighting support potential. Short-term holders tend to realize prices closer to recent spot levels, while long-term cohorts anchor the metric at lower historical values. This segmentation allows analysts to differentiate between retail-driven moves and institutional positioning. Visualizations often include moving averages of realized price to smooth daily fluctuations and reveal underlying trends.
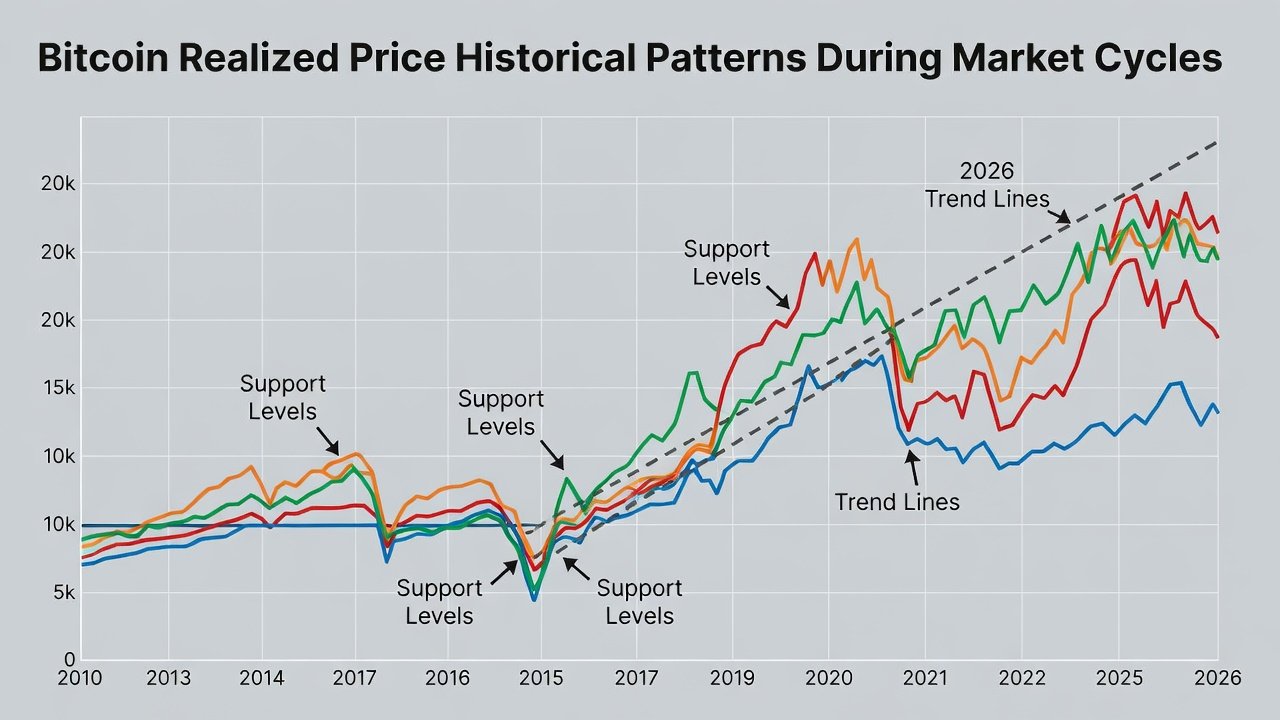
Traders use these visualizations to spot when short-term holders capitulate while long-term cohorts accumulate, creating favorable risk-reward setups.
Practical Examples for Entry and Exit Decisions
Consider a scenario where spot price approaches realized price from above: this may signal a buying opportunity as holders defend their cost basis. For exits, significant premiums above realized price combined with other signals can prompt profit-taking. These examples underscore the metric's role in timing without relying solely on price action. Another example involves monitoring when realized price begins rising steadily alongside increasing active addresses, indicating new capital inflow and potential trend continuation. In a 2026 context, such patterns help distinguish healthy pullbacks from deeper corrections. Users should always cross-reference with volume and funding data before acting on realized price signals alone.
Integration with Additional On-Chain Metrics
Pairing realized price with metrics like active addresses or transaction volume enhances analysis. This combination reveals whether movements stem from new participants or existing holders, offering deeper sentiment context. Exchange inflow data further refines interpretations by showing whether coins are moving toward or away from trading venues. When realized price rises in tandem with declining exchange reserves, it often points to strong holder conviction. These layered approaches transform a single metric into a robust framework for multi-timeframe analysis.
Limitations of Realized Price Analysis
While powerful, realized price does not account for off-chain activity or derivatives influence. It can lag during rapid market shifts and overlooks nuances in coin distribution among wallets. Users should treat it as one tool among many rather than a standalone signal. Large whale movements or exchange hacks may temporarily distort readings, requiring manual verification of on-chain flows. Additionally, the metric treats all coins equally regardless of wallet age or entity type, which can mask sophisticated strategies employed by institutions.
Combining Realized Price with Funding Rates and Volatility Tools
Funding rates from perpetual futures markets indicate leverage sentiment, complementing realized price's on-chain view. When funding spikes alongside a wide spot-to-realized gap, it may warn of overextension. Volatility indicators further refine risk assessment, helping traders adjust position sizes accordingly. A practical workflow involves overlaying realized price on a volatility-adjusted chart to identify low-risk entry zones during periods of compressed funding. This multi-metric approach reduces false signals and improves overall strategy robustness across different market regimes.
Common Mistakes to Avoid When Using Realized Price
- Ignoring the distinction between short-term and long-term realized price variants, which can lead to misreading holder behavior.
- Trading solely on crossovers without confirming volume or on-chain activity.
- Overlooking lost coins that permanently anchor older realization levels.
- Failing to update dashboards when new data sources become available.
Step-by-Step Tutorial for Custom Dashboards
- Access an on-chain analytics platform and select Bitcoin metrics.
- Add realized price alongside spot price and supply-adjusted variants.
- Incorporate funding rate overlays and volatility indices from reliable sources.
- Set alerts for crossovers or deviations exceeding historical norms.
- Export data for spreadsheet analysis or integrate with charting software for ongoing monitoring.
- Regularly backtest signals against past cycles to refine parameters and reduce lag.
This setup enables real-time tracking tailored to individual strategies and supports iterative improvements based on live market feedback.
FAQ on Common Trader Questions
What does it mean when spot price exceeds realized price?
It generally indicates aggregate unrealized gains, often coinciding with optimistic market phases and increased speculative activity.
How reliable is realized price for short-term trading?
It excels more for medium to long-term insights, as short-term noise can distort its signals and produce unreliable crossovers.
Can realized price predict exact bottoms?
No single metric offers precise predictions; it works best alongside multiple confirmations such as volume spikes and funding rate resets.
How does realized price behave during halving cycles?
Post-halving periods often see realized price accelerate upward as reduced issuance supports higher holder cost bases over time.
Conclusion
Bitcoin realized price remains an essential lens for understanding 2026 holder dynamics and market structure. By mastering its nuances and combining it with complementary tools, participants gain a robust framework for navigating cycles with greater confidence and discipline.
No comments yet. Be the first!