 CryptoChain Blog
Introduction to Funding Rates and Realized Price for BTC Reversals
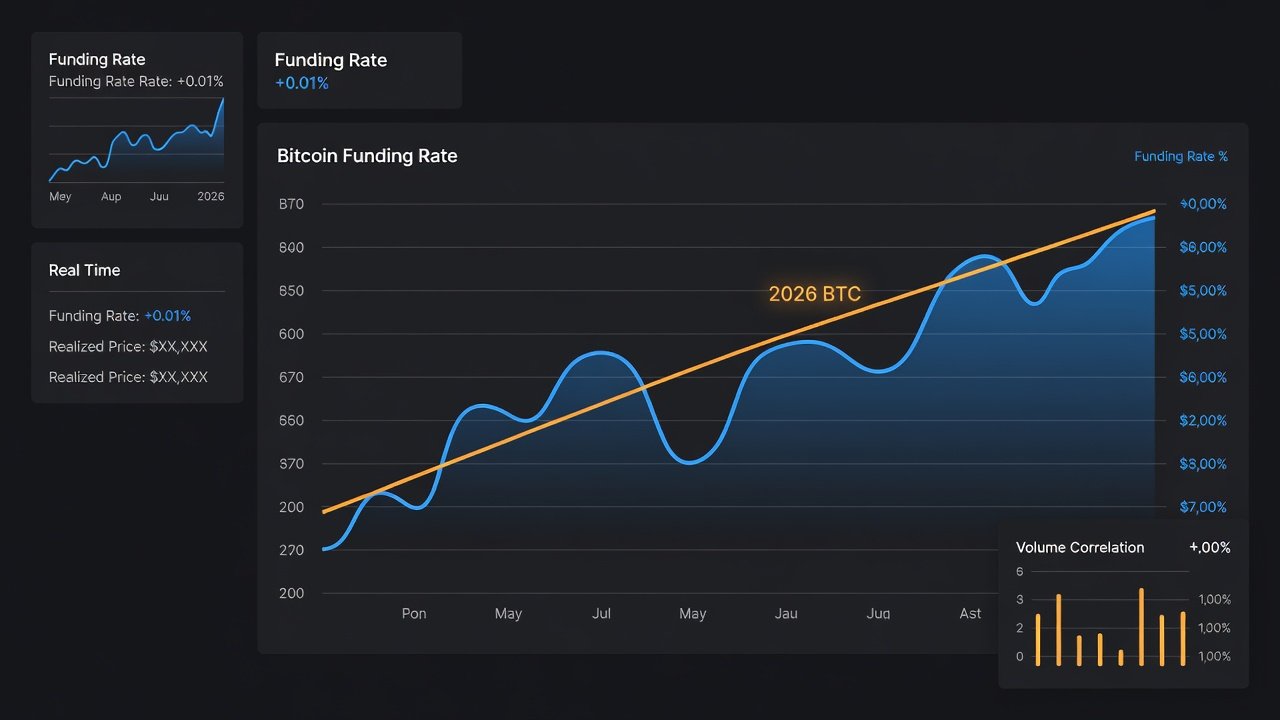
Traders seeking 2026 Bitcoin reversal opportunities can gain an edge by fusing perpetual futures funding rates with realized price divergences. This approach highlights when market sentiment and on-chain fundamentals diverge sharply, often preceding major price swings. Funding rates capture leveraged sentiment in derivatives markets while realized price reflects the average on-chain cost basis of Bitcoin holders. When these two metrics align in opposition, they frequently signal exhaustion points where reversals become probable. In this comprehensive guide we explore calculation methods in detail, historical confirmation patterns spanning 2021 through 2025, integration techniques with SOPR and exchange flows, and practical monitoring setups using Coinglass and Glassnode dashboards. We also provide actionable trade examples, common pitfalls to avoid, and a step-by-step checklist for building custom alerts.
Understanding Perpetual Futures Funding Rates
Funding rates represent periodic payments exchanged between long and short traders in perpetual contracts to keep prices aligned with spot markets. Most exchanges calculate funding every eight hours based on the difference between perpetual contract prices and spot prices. Positive rates indicate longs pay shorts, signaling bullish leverage and potential overcrowding on the long side. Negative rates show shorts paying longs, often marking fear-driven short squeezes or capitulation. High positive funding often precedes corrections when excessive optimism builds, while sustained negative funding near key support levels can mark bottoms.
Calculating Realized Price Divergences
Realized price is the volume-weighted average acquisition cost of all coins, derived from on-chain transaction data. It is calculated by summing the value of every UTXO at the price when it last moved and dividing by total circulating supply. Divergences occur when spot price moves far above or below realized price, indicating overvaluation or undervaluation. Traders typically monitor the ratio of market price to realized price; readings above 3.0 have historically coincided with cycle tops while readings below 0.8 often mark major accumulation zones. Combining these metrics reveals reversal setups when funding spikes coincide with price stretching well beyond realized levels.
Historical Confirmation Patterns 2021-2025
From 2021 bull market peaks, elevated funding rates paired with price exceeding realized price by wide margins preceded sharp drawdowns of 30 percent or more within weeks. In mid-2022, repeated negative funding near realized price lows during the bear market marked local bottoms before relief rallies. During the 2024 recovery phase, funding rate spikes above 0.1 percent daily averages while price traded 40 percent above realized price preceded short-term pullbacks. Similar patterns repeated in 2025 when divergences between funding extremes and realized price again flagged reversal zones ahead of volatility spikes. These recurring signals provide a reliable template for 2026 monitoring across different market regimes.
Integrating SOPR and Exchange Flows
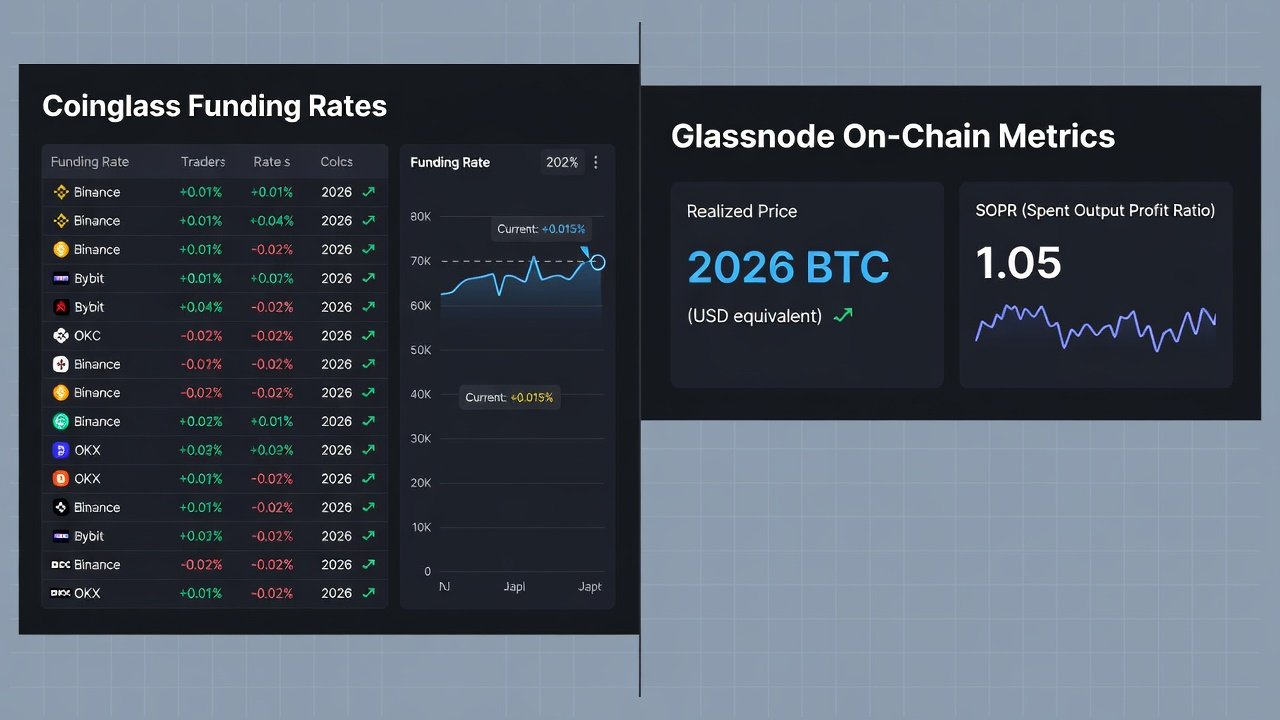
SOPR (Spent Output Profit Ratio) adds conviction by showing whether coins are moving at profit or loss. When funding rates turn negative while realized price holds steady and SOPR drops below 1, it often confirms capitulation and potential reversal. Exchange flows provide additional context: large inflows during positive funding spikes can indicate distribution, whereas outflows during negative funding near realized price suggest accumulation by strong hands. Combining these layers creates a multi-dimensional signal that filters out false positives common in single-metric strategies.
Step-by-Step Monitoring Setups Using Coinglass and Glassnode
Begin by visiting Coinglass to track BTC perpetual funding rates across major exchanges in real time. Navigate to the funding rate section, select Bitcoin perpetual contracts, and enable alerts for rates crossing +0.05 percent or -0.05 percent thresholds on an eight-hour basis. Export historical data for backtesting against past cycles. Next, use Glassnode dashboards to overlay realized price with SOPR and exchange net flows. Create custom views by adding the realized price metric, SOPR indicator, and exchange reserve charts. Set daily email summaries and configure webhook alerts for when realized price divergence exceeds 25 percent alongside funding extremes. Cross-reference both platforms every morning before market open to confirm confluence.
Actionable Trade Examples for 2026
Consider a scenario where funding rates reach extreme positives above 0.08 percent while price trades 35 percent above realized price and SOPR climbs above 1.3. This setup historically preceded reversals; traders might reduce long exposure by 50 percent or initiate protective put options with stops placed below the recent swing low. In another case, negative funding averaging -0.03 percent near realized price support combined with declining exchange inflows and SOPR below 0.9 signals a high-probability long entry. Position size at 1.5 percent of portfolio risk, target the next resistance near 1.2 times realized price, and trail stops using realized price as dynamic support. A third example involves mixed signals where funding normalizes but realized price divergence persists; in such instances, wait for full confluence before acting to avoid whipsaws.
Common Pitfalls and Risk Management Rules
- Avoid trading solely on one metric; always require confluence from at least two signals to reduce false positives.
- Account for 2026 volatility by sizing positions conservatively and using wider stops than in lower-volatility periods.
- Ignore short-term noise by focusing on daily or weekly aggregates rather than hourly spikes that often reverse quickly.
- Never risk more than 1-2 percent of capital per setup to survive extended drawdowns common in crypto cycles.
- Watch for manipulation around funding settlement times and avoid entering positions immediately before eight-hour resets.
- Backtest any custom alert thresholds against at least three prior market cycles before live deployment.
Practical Checklist for 2026 Signals
- Check Coinglass funding rate extremes daily at settlement times.
- Confirm realized price divergence magnitude on Glassnode charts.
- Validate with SOPR readings and exchange flow direction.
- Review historical analogs from 2021-2025 for similar setups.
- Apply strict position sizing and stop-loss rules before entry.
- Set custom alerts for combined thresholds across both platforms.
- Document each trade outcome to refine future signal accuracy.
- Reassess thresholds quarterly as market structure evolves.
FAQ on Building Custom Alerts for These Combined Signals
How do I set funding rate alerts on Coinglass? Use the platform alert feature to notify when rates breach your chosen levels across major exchanges, and combine with email or Telegram delivery options.
Can Glassnode trigger webhook alerts for realized price? Yes, premium users can configure API-based alerts tied to metric thresholds and integrate them with trading bots for automated monitoring.
What timeframes work best for these signals? Daily and weekly charts reduce noise while capturing meaningful divergences; avoid relying solely on intraday data.
Should I combine these with other indicators? Yes, layering with volume profiles or momentum tools strengthens conviction, but avoid overcomplicating the core funding-plus-realized-price fusion.
How often should I recalibrate alert thresholds? Review and adjust every quarter or after major market regime shifts to maintain relevance.
Are there free alternatives to Glassnode for realized price tracking? Basic on-chain data is available on several public explorers, but premium dashboards offer superior visualization and historical depth.
No comments yet. Be the first!