 CryptoChain Blog
Introduction to Bitcoin Realized Price and Funding Rates
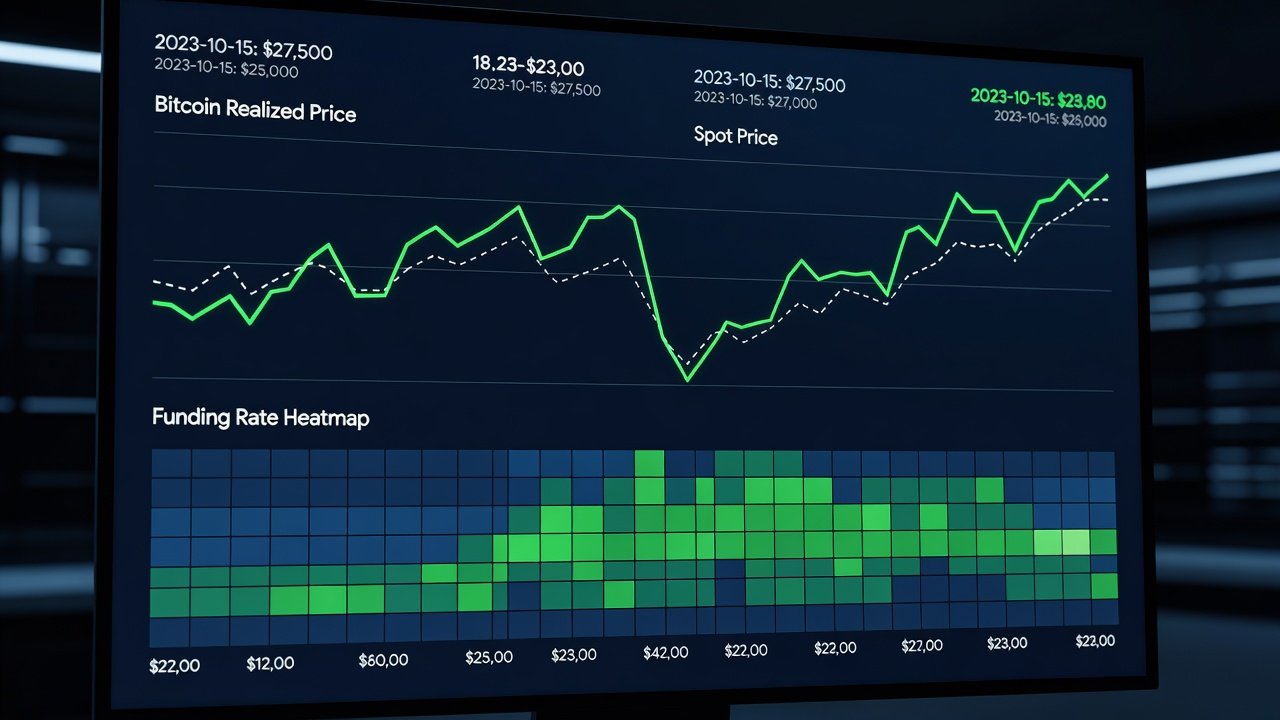
Traders seeking robust reversal signals in 2026 can gain an edge by fusing Bitcoin realized price divergences with perpetual futures funding rate data. This approach builds on established on-chain and derivatives metrics to identify high-probability turning points while filtering noise. Realized price reflects the average cost basis of Bitcoin holders, while funding rates reveal sentiment in the perpetual swap market. In volatile 2026 conditions driven by institutional adoption and regulatory shifts, combining these indicators helps distinguish genuine reversals from temporary fluctuations. Many traders overlook the synergy between these metrics, leading to missed opportunities or premature entries. Understanding their individual mechanics and joint behavior provides a clearer picture of market psychology and positioning.
Calculating Bitcoin Realized Price
Bitcoin realized price is derived by dividing the total realized market capitalization by the current circulating supply. It accounts for the price at which each coin last moved on-chain, providing a more accurate view of holder cost basis than spot price alone. To compute it manually, aggregate the realized value of all coins and divide by supply. Tools automate this process, but understanding the formula helps interpret divergences from spot price. For example, when spot price drops significantly below realized price, it often indicates capitulation among holders who bought at higher levels. Step-by-step calculation involves tracking UTXO values and their movement timestamps to build the realized cap metric accurately.
Understanding Perpetual Funding Rates
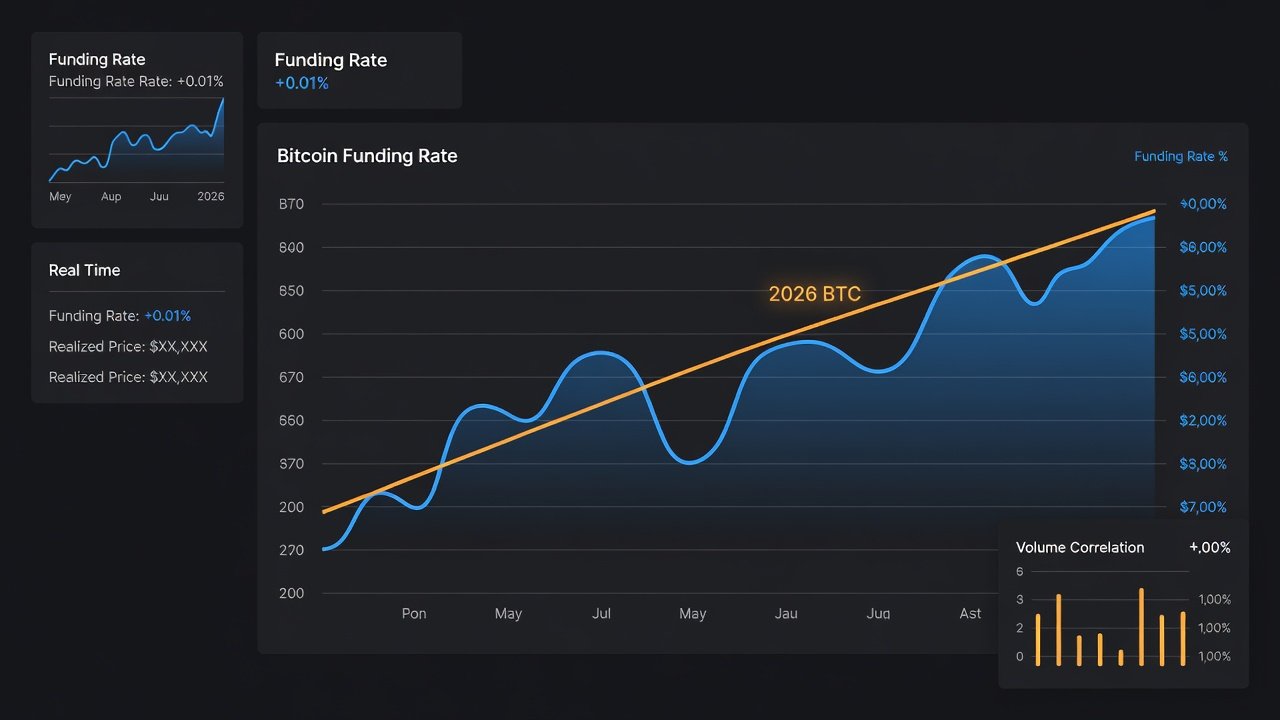
Perpetual funding rates are periodic payments between long and short traders to keep futures prices aligned with spot. Positive rates indicate bullish dominance as longs pay shorts, while negative rates signal bearish pressure with shorts compensating longs. In 2026, extreme funding rate spikes often precede reversals when paired with realized price data. Rates are typically calculated every eight hours on major exchanges, and sustained extremes above 0.05 percent daily can warn of over-leveraged positions. Conversely, deeply negative rates below -0.03 percent may highlight fear-driven shorting that sets up bounces.
Fusing the Two Metrics for Stronger Signals
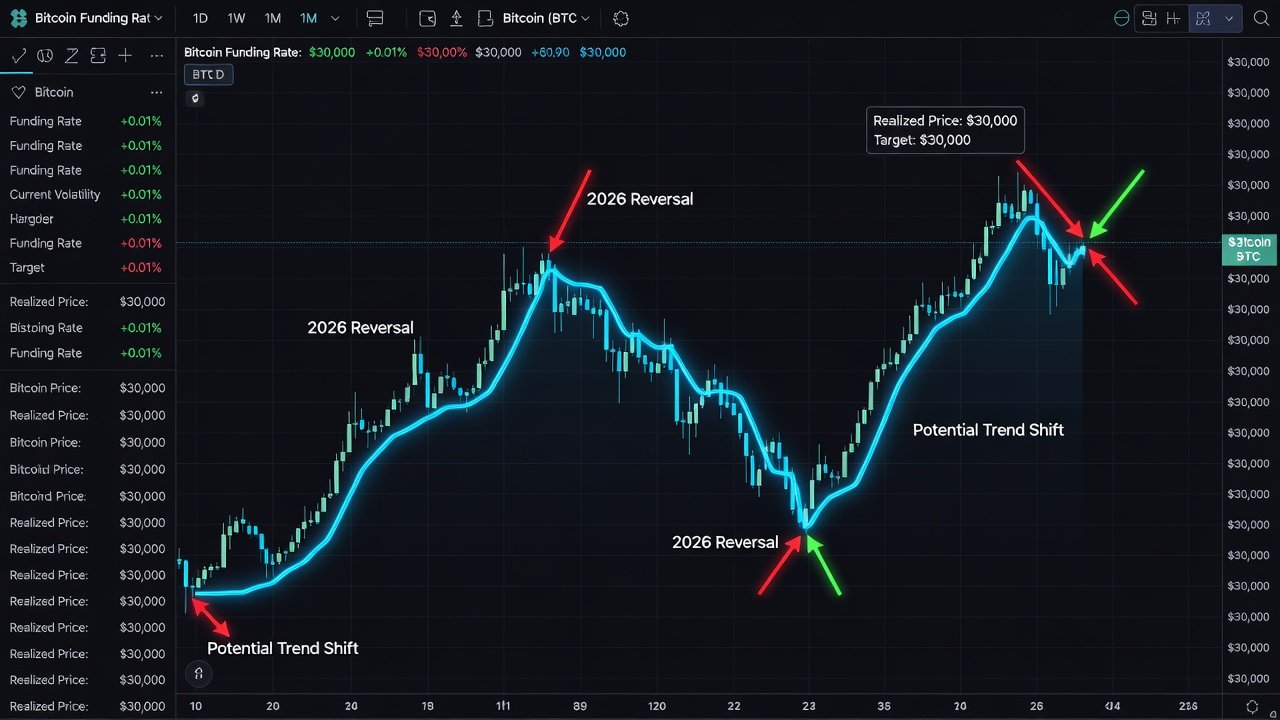
Signal fusion occurs when realized price shows a divergence (spot trading below realized price during accumulation) while funding rates remain elevated. This combination suggests leveraged longs may be overextended and vulnerable to liquidation cascades. Conversely, spot above realized price with deeply negative funding rates can flag capitulation bottoms where shorts are overcrowded. The fusion reduces false positives compared to using either metric in isolation. Traders should look for convergence across multiple exchanges to confirm the signal strength before acting.
Confirmation with SOPR and Open Interest
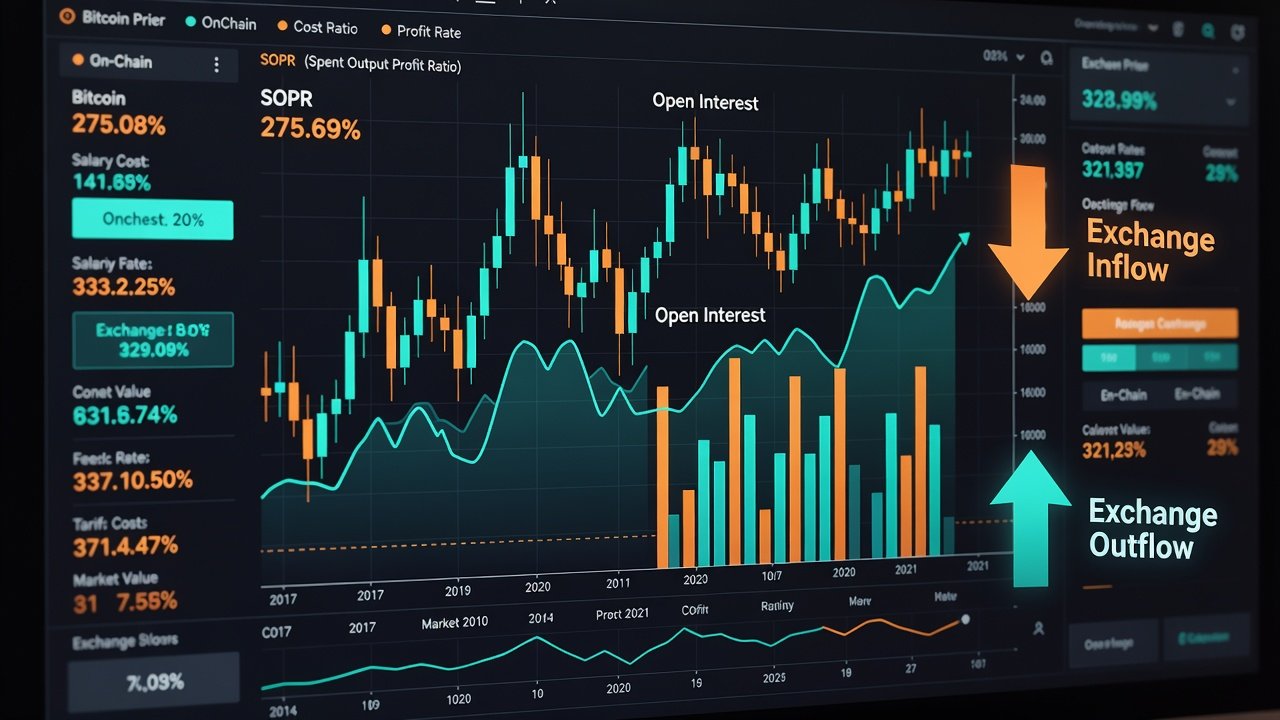
Spent Output Profit Ratio (SOPR) adds confirmation by showing whether coins are being sold at a profit or loss. Rising SOPR alongside the primary signal strengthens bullish reversals, while falling SOPR supports bearish interpretations. Open interest data reveals whether new positions are building or unwinding, providing volume context. When open interest contracts during a funding rate extreme, reversals gain credibility. Monitoring these alongside realized price helps validate entries and avoid traps in choppy markets. For deeper on-chain context, platforms track SOPR movements in real time to highlight profit-taking phases.
2021-2025 Case Studies
Historical examples illustrate the method's effectiveness across multiple cycles. In 2021, realized price divergences combined with funding rate peaks accurately flagged the May top and subsequent recovery rally into new highs. During 2022 bear market lows, negative funding with realized price support preceded the FTX collapse bottom, allowing prepared traders to identify accumulation zones. The 2023 cycle showed patterns around ETF approval volatility where fused signals caught the March low and October continuation. In 2024, post-halving dynamics paired with funding extremes highlighted mid-year corrections and year-end strength. 2025 examples demonstrated resilience during regulatory news events, where SOPR confirmation filtered out false signals during low-volume periods. Each case underscores the value of multi-metric confirmation over single-indicator reliance.
Free Dashboard Setups on Glassnode and Coinglass
Traders can build custom dashboards without paid subscriptions. On Glassnode, combine the realized price metric with SOPR and exchange flow indicators using their studio interface. Set custom alerts for divergences exceeding two standard deviations from historical norms. Coinglass provides free perpetual funding rate charts and open interest overlays that can be synchronized with spot data. Step-by-step, start by selecting Bitcoin perpetual contracts, add funding rate heatmaps, then layer realized price from complementary on-chain sources. Set alerts for funding rate extremes coinciding with realized price crossovers to receive timely notifications.
Practical Checklist for High-Probability Entries
- Confirm realized price divergence of at least 10 percent from spot price on daily or weekly charts.
- Check funding rate extremes (above +0.05 percent or below -0.03 percent daily average across major exchanges).
- Validate with SOPR crossing key levels such as 1.0 and open interest trends showing contraction or expansion.
- Review exchange flows for net inflows or outflows exceeding recent averages to confirm conviction.
- Wait for candlestick confirmation on daily timeframe before entry to reduce whipsaw risk.
- Define risk with stops below recent swing lows or above realized price levels.
- Size positions conservatively, allocating no more than 2-3 percent of capital per signal.
- Monitor multiple timeframes for alignment before executing trades.
Common Pitfalls and Filtering with Exchange Flows
False signals often arise during low-volume holiday periods or when funding rates decouple from spot activity due to thin order books. Filter these by monitoring exchange flows on platforms like Glassnode; sustained inflows during a supposed bottom signal often invalidate the setup. Additional pitfalls include ignoring cross-exchange discrepancies in funding data or overlooking macroeconomic events that override technical signals. Always cross-reference multiple timeframes and wait for volume confirmation to avoid whipsaws in 2026 trading environments.
Actionable FAQs on Applying the Method in 2026 Trading
How often should I check these signals?
Review daily and weekly charts, with alerts set for metric thresholds to catch intraday developments without constant screen time.
Can this work on altcoins?
The fusion is optimized for Bitcoin due to deeper derivatives liquidity; altcoin versions require adjusted parameters and lower conviction thresholds.
What timeframe performs best?
Daily and 4-hour charts yield the most reliable fused signals for swing trading in 2026 conditions, while weekly charts suit longer-term positioning.
How do I handle conflicting signals across exchanges?
Average funding rates from top platforms and require at least two exchanges to align before treating the signal as valid.
Is backtesting necessary before live use?
Yes, backtest the fused strategy on at least three prior cycles using historical Glassnode and Coinglass data to calibrate thresholds.
Conclusion
By systematically fusing Bitcoin realized price with funding rates and confirming via SOPR, open interest, and exchange flows, traders position themselves for higher-probability reversals throughout 2026. Consistent application of the checklist and dashboard monitoring turns these concepts into actionable trading discipline. Regular review of case studies and ongoing refinement of filters will further enhance performance as market dynamics evolve.
No comments yet. Be the first!