 CryptoChain Blog

Understanding Bitcoin Market Cycles in 2026
Bitcoin market cycles have historically followed predictable patterns driven by supply shocks, investor sentiment, and macroeconomic events. With the next halving cycle effects lingering into 2026, traders and investors need robust methods to spot accumulation zones, bull runs, distribution peaks, and bear bottoms. This guide provides a detailed framework for analyzing these cycles with a sharp focus on 2026 opportunities, helping both beginners and experienced participants navigate volatility while maximizing potential returns.
Market cycles are not random; they reflect the interplay between new supply issuance, holder behavior, and external capital inflows. Understanding these dynamics allows for better timing of entries and exits, reducing emotional decision-making during periods of extreme fear or greed. In 2026 specifically, institutional participation through exchange-traded products and evolving global regulations introduce new variables that can compress or extend traditional timelines.
The Four Classic Phases of Bitcoin Cycles
Every Bitcoin cycle typically unfolds in four distinct stages. The accumulation phase occurs after capitulation when smart money quietly builds positions at depressed prices. During this period, trading volume remains low, and sentiment is overwhelmingly negative, creating opportunities for long-term holders. The markup or bull run phase follows, fueled by rising adoption and positive news that attracts retail investors and drives prices higher in parabolic moves.
The distribution phase sees early investors taking profits amid euphoria, often marked by high media coverage and increased leverage in derivatives markets. Finally, the markdown or bear phase brings widespread selling and fear, leading to capitulation events that reset the cycle. In 2026, these phases may accelerate or extend due to institutional ETF inflows and regulatory clarity. Recognizing transitions requires combining price action with on-chain data rather than relying on charts alone. Historical analysis shows that accumulation phases can last 12 to 18 months, while bull runs often peak within 12 to 24 months after halving events.
Key On-Chain Signals for Cycle Analysis
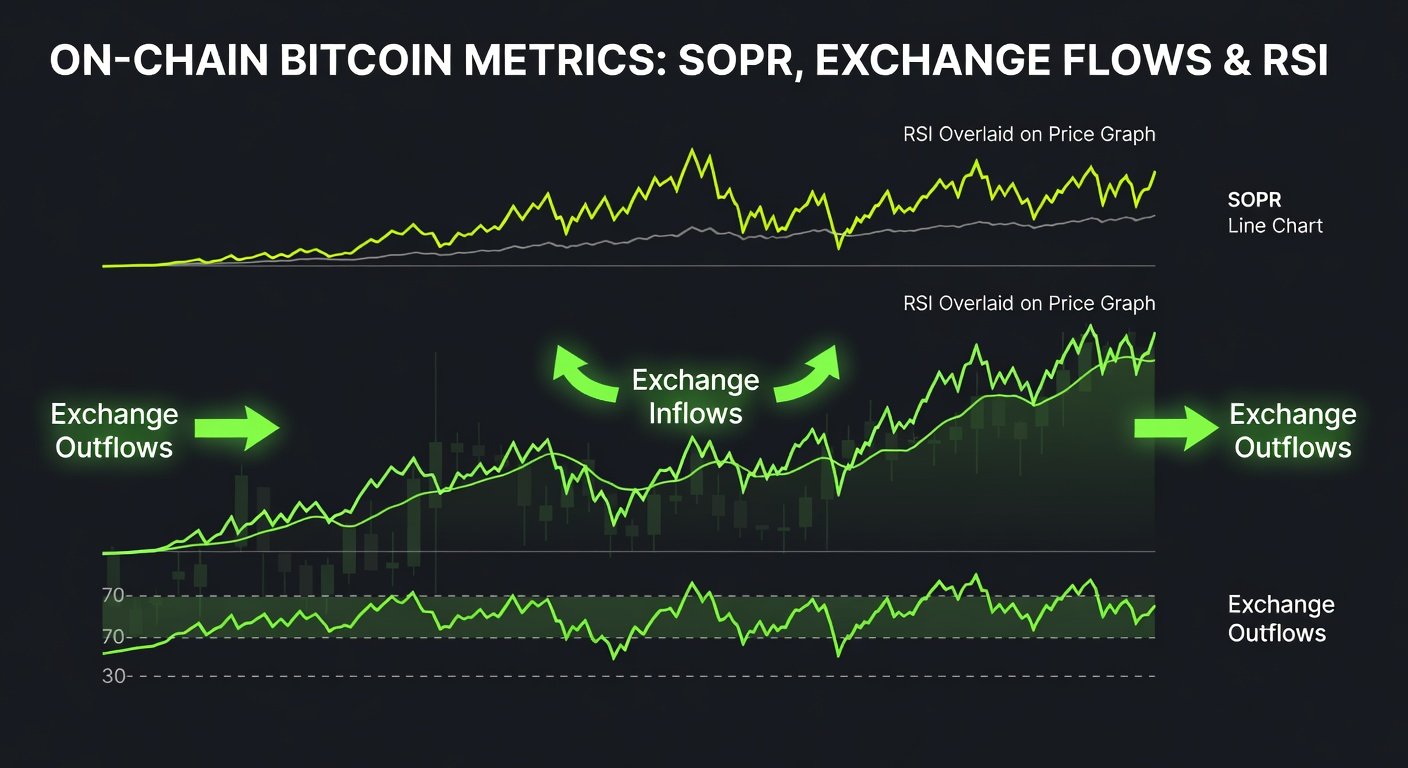
On-chain metrics offer objective insights into holder behavior that price charts alone cannot reveal. SOPR (Spent Output Profit Ratio) helps identify when coins are moving at a profit or loss, signaling potential tops and bottoms. When SOPR rises above 1 consistently during upward price moves, it indicates strong profit-taking pressure that may precede corrections. Exchange flows reveal accumulation or distribution by institutions and whales. Rising exchange inflows often precede sell-offs, while outflows suggest long-term holding and reduced selling pressure.
Additional useful metrics include the Market Value to Realized Value (MVRV) ratio, which compares current market price to the average cost basis of all coins, and active address counts that track network engagement. Rising hash rates during bear phases demonstrate miner confidence and network security. Combining these with network fundamentals like active addresses and hash rate provides confirmation of cycle strength. Free tools such as those from Glassnode or CryptoQuant allow anyone to track these metrics without paid subscriptions, enabling real-time monitoring of supply movements across the blockchain.
2026 News Catalysts and Their Impact
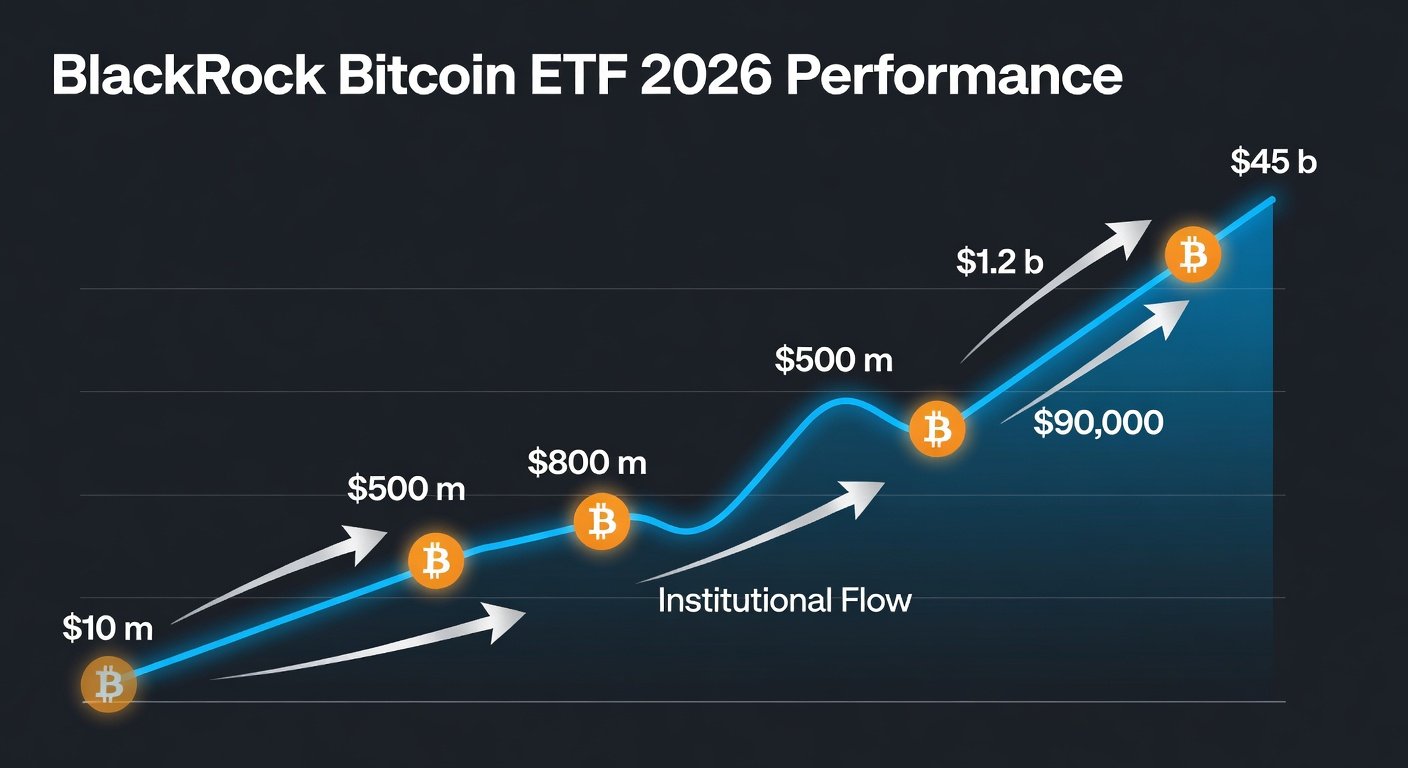
Several events can shift cycle timing in 2026. Potential ETF approval expansions, central bank digital currency developments, and global regulatory frameworks will influence capital flows into Bitcoin. Halving effects from 2024 continue to reduce new supply, often creating delayed bullish pressure into the following years as scarcity narratives gain traction among institutions.
Traders should monitor announcements from bodies like the U.S. Securities and Exchange Commission and track macroeconomic indicators that historically correlate with risk-on sentiment. Geopolitical developments, interest rate decisions, and technological upgrades such as improvements in Lightning Network adoption can also act as accelerators. For instance, clearer tax frameworks in major economies may encourage corporate treasury allocations, extending bull phases beyond historical averages. Staying informed through official channels helps anticipate how these catalysts interact with on-chain trends.
Step-by-Step: Combining RSI, SOPR, and Exchange Flows
- Start with daily and weekly RSI on major charting platforms to spot overbought or oversold conditions. Readings above 70 often align with distribution phases, while below 30 suggest accumulation. Adjust periods based on your timeframe, using 14-day RSI for short-term signals.
- Overlay SOPR data to confirm whether realized profits are peaking. A SOPR spike above 1 during high RSI readings strengthens the case for a local top, particularly when combined with rising exchange deposits.
- Monitor exchange net flows using on-chain dashboards. Sustained negative flows (coins leaving exchanges) during RSI dips provide high-probability entry signals, as they indicate coins moving to cold storage for long-term holding.
- Use free tools like TradingView for RSI and integrate public on-chain dashboards for SOPR and flows. Set alerts for threshold breaches to avoid constant manual checking.
- Backtest the combined signals against prior cycles to calibrate thresholds for 2026 conditions, accounting for increased institutional volume that may dampen volatility compared to earlier cycles.
- Finally, layer in macroeconomic context such as Federal Reserve policy shifts to refine timing and manage position sizing accordingly.
Real 2026 Examples: Timing Entries and Exits
Consider a hypothetical scenario where Bitcoin approaches a resistance level amid strong ETF inflows. If RSI climbs above 75 while SOPR remains elevated and exchange inflows spike, this confluence signals distribution. Exiting portions of a position here protects gains ahead of potential markdown. Another example involves a mid-cycle correction triggered by regulatory headlines; monitoring SOPR dropping below 1 alongside accelerating outflows can identify the bottom of that correction for re-entry.
Conversely, during a fear-driven dip with RSI near 25, SOPR dropping below 1, and accelerating exchange outflows, accumulation becomes attractive. Historical patterns around previous halvings show these setups often precede strong recoveries within 6 to 12 months. In 2026, ETF-driven demand could amplify these recoveries, making early identification of accumulation even more valuable for positioning ahead of the next markup phase.
Common Mistakes to Avoid: A Checklist
- Over-relying on price charts without on-chain confirmation, which often leads to buying tops or selling bottoms during emotional extremes.
- Ignoring macroeconomic context that can delay cycle turns, such as unexpected interest rate hikes or global liquidity crunches.
- Entering positions solely on halving hype without flow analysis, resulting in purchases during late-stage distribution rather than true accumulation.
- Failing to scale out during distribution phases, leaving portfolios exposed to sharp drawdowns in the subsequent bear market.
- Using unverified data sources instead of established dashboards, which introduces errors in signal interpretation and timing.
- Neglecting risk management techniques like position sizing and stop-loss placement when signals align across multiple metrics.
Frequently Asked Questions
How long do Bitcoin market cycles typically last?
Historical cycles average four years, aligned with halving events, though external catalysts can compress or extend phases by 12 to 18 months depending on adoption rates and liquidity conditions.
Can 2026 catalysts change cycle length?
Yes. Institutional adoption through ETFs and clearer regulations may shorten bear phases while extending bull runs compared to earlier cycles, potentially creating more frequent but milder volatility periods.
Which free tools are best for beginners?
TradingView for technical indicators and public versions of on-chain analytics platforms provide sufficient data for most cycle analysis needs without requiring paid subscriptions.
Should retail investors focus only on on-chain signals?
No. Combining on-chain data with technical indicators like RSI and broader market context yields more reliable results than using any single category of analysis in isolation.
Conclusion
Analyzing Bitcoin market cycles for 2026 gains requires blending classic phase recognition with modern on-chain tools and awareness of upcoming catalysts. By systematically applying RSI, SOPR, and exchange flow analysis, investors can improve entry and exit timing while avoiding common pitfalls. Stay disciplined, verify signals across multiple metrics, and adapt to evolving 2026 developments for the best results. Continuous learning and backtesting remain essential as the market matures with greater institutional involvement.

No comments yet. Be the first!