 CryptoChain Blog

Introduction to Advanced Indicator Stacking in 2026
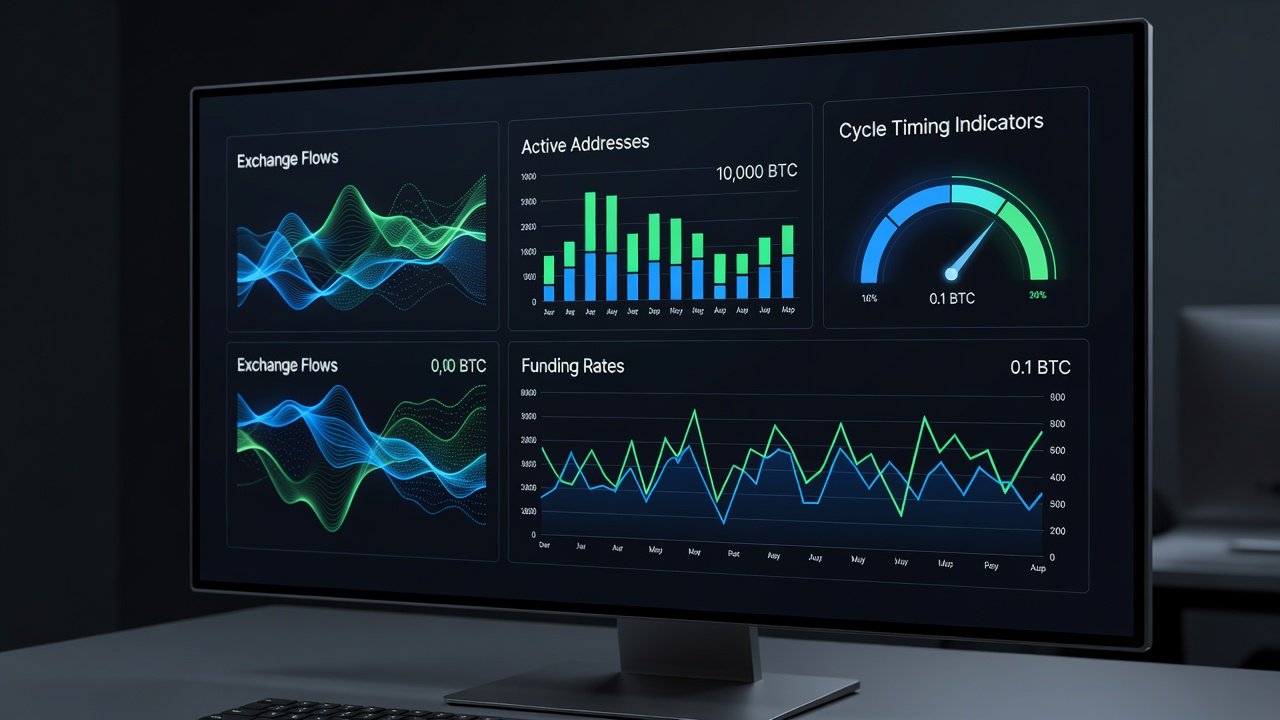
The cryptocurrency market in 2026 continues to exhibit sharp volatility driven by macroeconomic shifts, regulatory developments, and institutional adoption. Mastering cycle timing requires moving beyond single indicators to layered signal stacking. This approach combines on-chain metrics like active addresses and exchange flows with volume patterns and momentum oscillators for precise phase detection. Intermediate traders benefit from this method because it filters noise and improves entry and exit timing. Stacking reduces false signals that plague isolated metrics during uncertain periods. By integrating multiple data streams, traders gain a clearer view of market phases, whether accumulation, distribution, or transition points. This comprehensive framework draws on real market behavior observed in prior cycles while adapting to 2026-specific factors such as increased institutional flows and evolving on-chain transparency tools.
Why Single Indicators Fall Short in Volatile Markets
Relying on one tool, such as the Relative Strength Index alone, often leads to premature or delayed decisions. In 2026 scenarios, rapid sentiment swings can distort oscillator readings and create misleading signals during low-volume periods. Stacking creates confirmation layers that validate trends across multiple data sources. For example, a momentum oscillator may flash oversold conditions while on-chain activity remains subdued, leading to whipsaw trades. Historical analysis shows that single-metric strategies underperform when market participants shift rapidly between retail-driven pumps and institutional rebalancing. Layered signals provide the necessary cross-verification to navigate these complexities effectively.
Core Components of the Stacking Framework
On-Chain Metrics: Active Addresses and Exchange Flows
Active addresses track unique wallet interactions, signaling network health and user engagement. Rising active addresses during price consolidation often precede bullish phases as new participants enter the ecosystem. Exchange flows measure coin movements to and from trading platforms; large inflows may indicate selling pressure while outflows suggest accumulation by long-term holders. In 2026, these metrics have gained precision due to improved blockchain analytics platforms that segment retail versus institutional flows more accurately.
Volume Patterns and Momentum Oscillators
Volume analysis reveals conviction behind price moves. Increasing volume on upswings confirms strength, while declining volume on rallies signals potential weakness. Momentum oscillators like MACD and Stochastic provide timing cues when aligned with on-chain data. Combining these elements allows traders to distinguish between genuine breakouts and liquidity-driven spikes common in 2026 volatility.

Step-by-Step Stacking Framework
Implementing the framework requires disciplined daily routines. First, monitor baseline on-chain activity for 7-14 days to establish norms specific to the asset. Second, layer volume confirmation on any breakout attempt by comparing current volume to the 20-day and 50-day averages. Third, apply momentum oscillator crossovers only when on-chain and volume data align, avoiding isolated signals. Fourth, define risk thresholds based on stacked confirmation strength, such as tightening stops when only two layers confirm. Fifth, backtest the full stack on historical 2024-2025 data before live deployment. Sixth, review weekly for any regime shifts in market structure that might require parameter adjustments.
2026 Real-World Scenario Examples
Consider a mid-2026 Bitcoin consolidation where active addresses spike 25% while exchange outflows increase steadily over ten days. Volume rises above the 30-day average and MACD shows a bullish crossover on the daily chart. This stacked signal points to an accumulation phase entry with a defined stop-loss below recent swing lows. Another example involves Ethereum during a regulatory rumor period: active addresses drop sharply alongside heavy exchange inflows, volume contracts, and oscillators turn bearish in alignment. Traders using the stack exit positions early, avoiding a subsequent 18% drawdown. A third scenario features altcoin season where volume surges coincide with rising active addresses and positive momentum divergence, signaling a high-conviction rotation into smaller caps.
Risk-Adjusted Entry and Exit Rules
Enter positions only on triple confirmation to minimize exposure. Exit when two or more layers diverge, protecting capital during transitions. Position sizing should reflect signal strength, allocating larger sizes to high-conviction stacks while keeping overall portfolio risk below 2% per trade. Incorporate trailing stops that activate only after initial targets are met. Always account for slippage in fast-moving 2026 markets by using limit orders rather than market orders when possible.
Comparison: Single vs Stacked Signals
| Aspect | Single Indicator | Stacked Approach |
|---|---|---|
| Signal Accuracy | Moderate, prone to whipsaws | High, multi-layer validation |
| False Positive Rate | 35-45% in volatile periods | 15-20% with alignment |
| Timing Precision | Variable | Consistent phase detection |
| Risk Management | Reactive | Proactive with confirmations |
| Adaptability to 2026 Trends | Limited | Robust across regimes |
Common Mistakes to Avoid
Traders often over-optimize parameters on past data, leading to curve-fitting that fails in live 2026 conditions. Another frequent error is ignoring divergence between layers during low-liquidity weekends. Avoid chasing signals without volume support and always maintain a trading journal to review stack performance weekly.
Daily Application Checklist
- Review active address trends from the prior session and compare to weekly averages.
- Check exchange flow net direction using reliable on-chain dashboards.
- Confirm volume relative to 20-day and 50-day averages for the asset.
- Assess oscillator alignment before any trade decision.
- Document stacked signal strength in a trading journal with screenshots.
- Re-evaluate stops and targets based on current layer consensus.
- Scan for macro news that could override technical stacks.
Short FAQ: Avoiding False Signals
How do I handle conflicting layers?
Pause trading until at least two layers realign. Conflicting data often precedes major reversals or consolidation periods.
What timeframes work best for stacking?
Daily and 4-hour charts provide reliable confirmation in 2026 cycles while avoiding intraday noise that can generate excessive false positives.
Can this framework apply to altcoins?
Yes, but adjust baseline periods for lower-liquidity assets and require stronger volume confirmation to account for manipulation risks.
How often should parameters be reviewed?
Conduct a full review monthly or after significant market events such as halvings or regulatory announcements.
Conclusion
Advanced indicator stacking equips traders with a robust system for navigating 2026 crypto volatility. By integrating on-chain metrics, volume, and momentum, you achieve clearer phase detection and disciplined risk management. Apply the framework consistently to build an edge in evolving markets. For foundational blockchain concepts, explore Bitcoin.org, Ethereum.org, and Investopedia.
No comments yet. Be the first!