 CryptoChain Blog
Introduction to Crypto Cycle Timing in 2026
Timing the crypto market cycles remains one of the most challenging yet rewarding skills for investors and traders. With the 2026 cycle unfolding amid evolving regulations, institutional adoption, and shifting macroeconomic conditions, a custom indicator dashboard can provide a structured edge over relying on price action alone. This comprehensive guide walks you through assembling a practical dashboard focused on on-chain metrics, volume patterns, and sentiment signals to identify potential bull and bear phases with greater confidence.
Building your own system helps filter noise from social media hype and focuses on verifiable data. By combining exchange flows, active addresses, funding rates, and additional layers such as realized price metrics and social sentiment aggregates, you create a multi-layered view that supports better decision-making throughout volatile periods. The goal is not to predict exact tops and bottoms but to recognize regime shifts early enough to adjust exposure systematically.
Why a Custom Dashboard Matters for 2026
Market cycles in crypto often follow patterns influenced by Bitcoin halvings, liquidity injections, regulatory announcements, and global risk appetite. A dedicated dashboard lets you monitor real-time changes without relying solely on lagging price charts or emotional reactions. It emphasizes leading indicators that historically precede major moves, giving you time to adjust positions proactively rather than chasing momentum after it has already peaked.
Without a structured approach, traders frequently fall into common traps such as over-leveraging during euphoric phases or panic-selling during capitulation. A well-designed dashboard enforces discipline by requiring confluence across multiple data points before signaling a change in market regime. This becomes especially valuable in 2026 as institutional flows introduce new dynamics that retail-driven signals may miss.
Core Indicators to Include
Exchange Flows
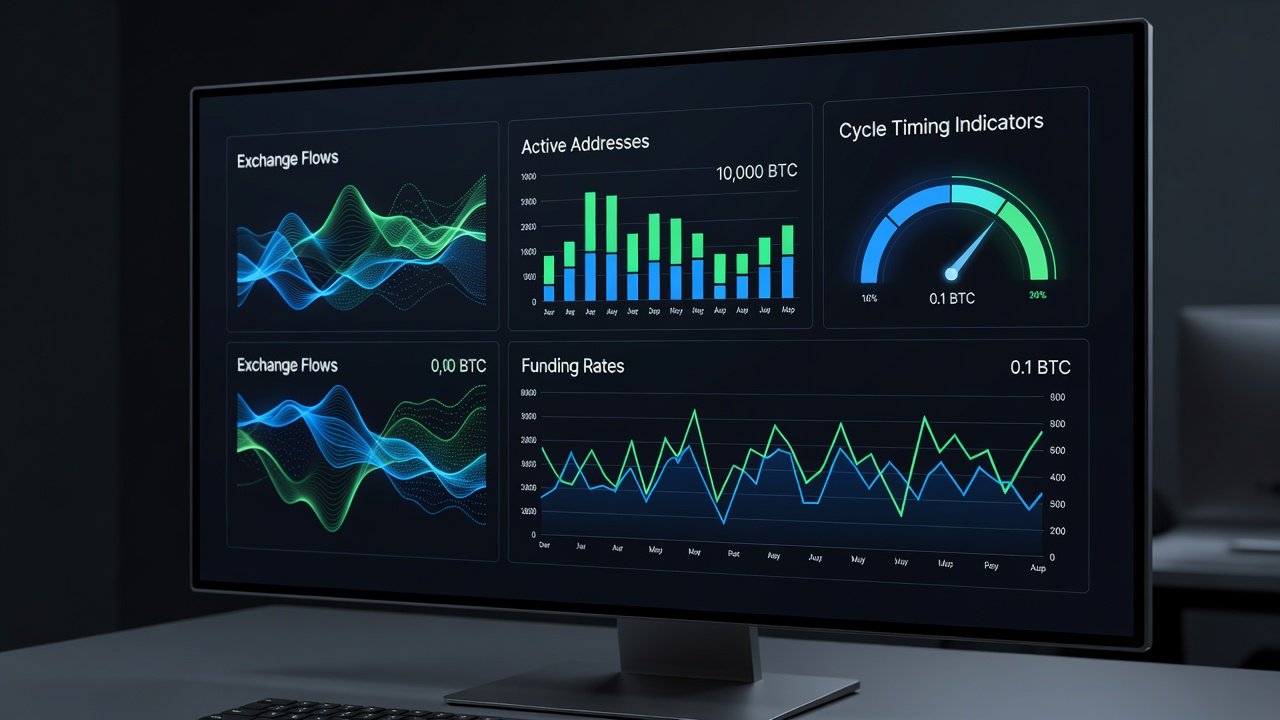
Exchange inflows and outflows reveal whether holders are moving assets to trading platforms, potentially creating selling pressure, or withdrawing to self-custody, which often signals accumulation. Track net flows on major exchanges using data from providers like Glassnode. Step-by-step setup includes connecting your analytics account to exchange APIs, creating alerts for spikes above historical averages, and visualizing trends as line charts with 30-day and 90-day moving averages overlaid for context.
For example, sustained net outflows exceeding 10,000 BTC over a seven-day window have historically coincided with local bottoms in prior cycles. Conversely, large inflows during price rallies can warn of distribution. Always compare flows against total exchange reserves to avoid false signals from routine trading activity.
Active Addresses
Daily active addresses measure network usage and organic adoption. Rising counts during price dips often signal genuine growth rather than speculative pumps driven by leverage. Implementation involves pulling data from on-chain explorers, plotting against price action, and setting thresholds based on 90-day baselines for your chosen assets. Break down the metric by cohort, such as addresses with balances above 0.1 BTC, to distinguish between retail and larger player activity.
Funding Rates
Perpetual futures funding rates indicate sentiment in derivatives markets. Moderately positive rates suggest a healthy long bias, while extreme readings or deeply negative rates may point to oversold conditions ripe for reversal. Setup involves integrating data from derivatives platforms and overlaying with spot metrics for confirmation. Monitor both hourly and 8-hour funding averages to capture short-term sentiment shifts.
Volume Patterns and Sentiment Signals
Complement on-chain data with trading volume trends and aggregated sentiment from social platforms. Increasing volume on up days supports bullish continuation, while declining volume during rallies often precedes reversals. Sentiment tools can quantify fear and greed levels, providing an additional filter when on-chain signals are mixed.
Step-by-Step Dashboard Setup
Begin by selecting a visualization platform such as Google Data Studio or a dedicated crypto analytics tool. Import data feeds for each indicator using API connections. Organize the layout into four quadrants: one for flows, one for address activity, one for derivatives metrics, and one for composite signals. Configure automated alerts via email or messaging apps when multiple indicators cross predefined thresholds simultaneously. Test the setup on historical data from 2024-2025 to calibrate sensitivity before applying it live in 2026.
Bull vs Bear Phase Signal Comparison
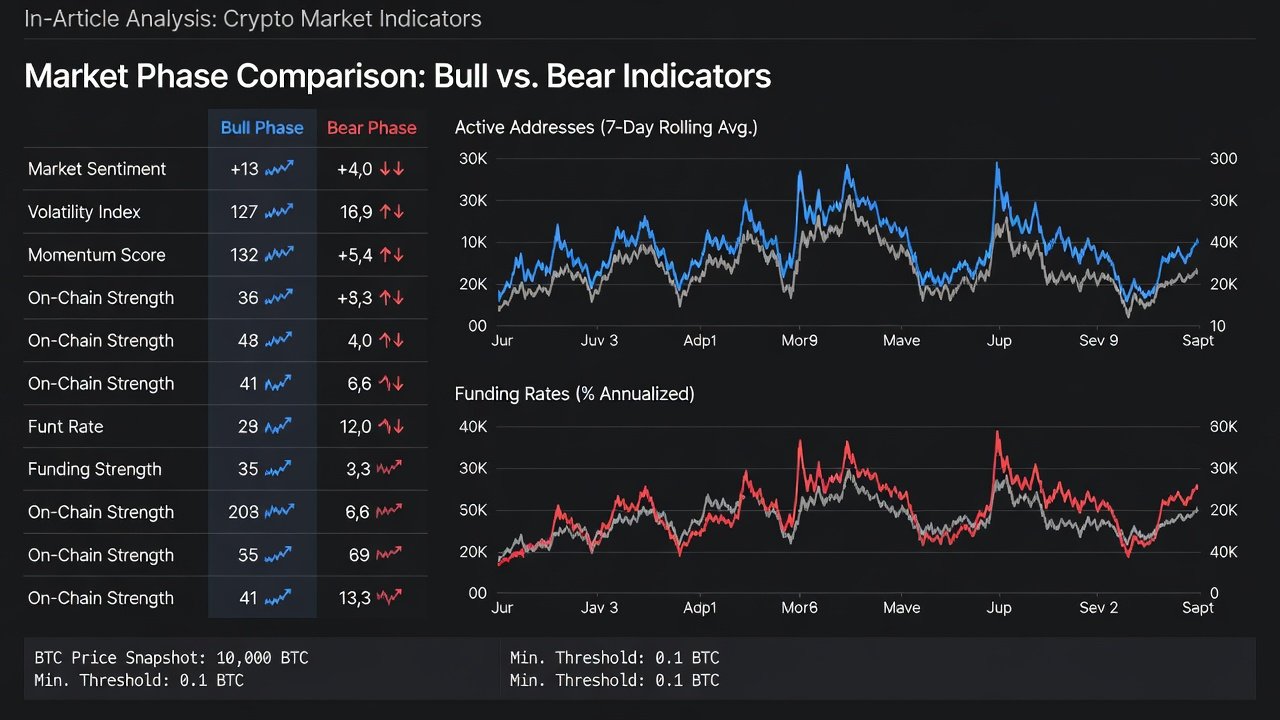
Understanding how indicators behave across regimes helps avoid misinterpretation. The table below summarizes key differences:
| Indicator | Bull Phase Signals | Bear Phase Signals |
|---|---|---|
| Exchange Flows | Net outflows, low inflows | High inflows, accumulation on exchanges |
| Active Addresses | Steady or rising growth | Sharp declines or stagnation |
| Funding Rates | Moderately positive, sustainable | Extreme positive or deeply negative |
| Volume Patterns | Increasing on up days | Declining overall with spikes on down days |
| Sentiment Signals | Gradual improvement, not euphoric | Extreme fear or complacency |
Risk Rules for Position Sizing
Effective dashboards incorporate risk management to protect capital during uncertain periods. Limit single-position exposure based on overall portfolio volatility rather than fixed percentages. Use indicator confluence—require at least three aligned signals before increasing size. Rebalance quarterly based on dashboard readings and maintain dynamic stop-loss rules tied to key on-chain thresholds such as exchange reserve levels. Document every trade decision with a brief note referencing which indicators triggered the move to build a personal performance log over time.
Mini Case Study: 2025-2026 Market Swing
During the late 2025 correction into the early 2026 recovery, exchange outflows accelerated while active addresses stabilized after an initial drop. Funding rates normalized from extreme positive levels as leverage was flushed from the system. Traders using similar dashboards reduced exposure in December 2025 when inflows spiked and sentiment turned overly optimistic. They re-entered gradually in February 2026 as outflows resumed and address growth turned positive again, capturing the subsequent upswing while avoiding deeper drawdowns experienced by those relying purely on price momentum.
Common Mistakes to Avoid
- Over-relying on a single indicator without seeking confluence from others.
- Ignoring data lags by using only one source instead of cross-verifying across platforms.
- Failing to adjust thresholds as market maturity changes in 2026.
- Neglecting to backtest the full dashboard on at least two prior cycles.
Data Sources for Ongoing Monitoring
Reliable data underpins any effective dashboard. Start with established on-chain analytics platforms and supplement with public blockchain explorers. Cross-reference derivatives data from major exchanges and monitor macro indicators through official economic calendars. Regular weekly reviews of your dashboard ensure the framework remains relevant as new data emerges throughout the cycle. Resources such as DefiLlama for DeFi flows and Bitcoin.org for foundational protocol metrics provide strong starting points.
FAQ: Common Setup Errors and Data Sources
- How do I avoid data lag? Use multiple providers and cross-verify with independent explorers to ensure timely updates.
- Best free data sources? Public blockchain explorers offer basic metrics; upgrade to paid tiers when you need custom alerts and historical depth.
- What if signals conflict? Default to neutral positioning and smaller position sizes until clear confluence returns across at least three indicators.
- How often should I review the dashboard? Daily scans for alerts combined with deeper weekly analysis work well for most users.
Regular monitoring through structured dashboard reviews keeps your framework current as the 2026 cycle progresses and new market dynamics emerge.
No comments yet. Be the first!