 CryptoChain Blog
Introduction to On-Chain Volume in the 2026 Cycle
Timing entries in the 2026 crypto market requires moving beyond broad indicators to precise on-chain volume and liquidity metrics. These tools reveal accumulation and distribution phases through exchange flows and whale activity, helping intermediate traders identify high-probability setups. This framework builds on market cycle mastery by focusing on volume patterns that signal shifts before price action confirms them. In previous cycles, traders who ignored volume nuances often entered too late or exited prematurely, leading to suboptimal results. By 2026, with increased institutional involvement and regulatory clarity emerging in major jurisdictions, on-chain data becomes even more critical as a leading indicator. Understanding these metrics allows traders to align entries with institutional flows rather than retail sentiment. On-chain data from sources like Glassnode provides transparent views into network activity that centralized exchanges obscure, offering a clearer picture of true supply and demand dynamics.
Volume analysis also helps differentiate between organic growth and artificial pumps driven by leverage. This depth of insight supports better risk management across volatile periods expected in 2026.
Key On-Chain Volume Metrics Explained
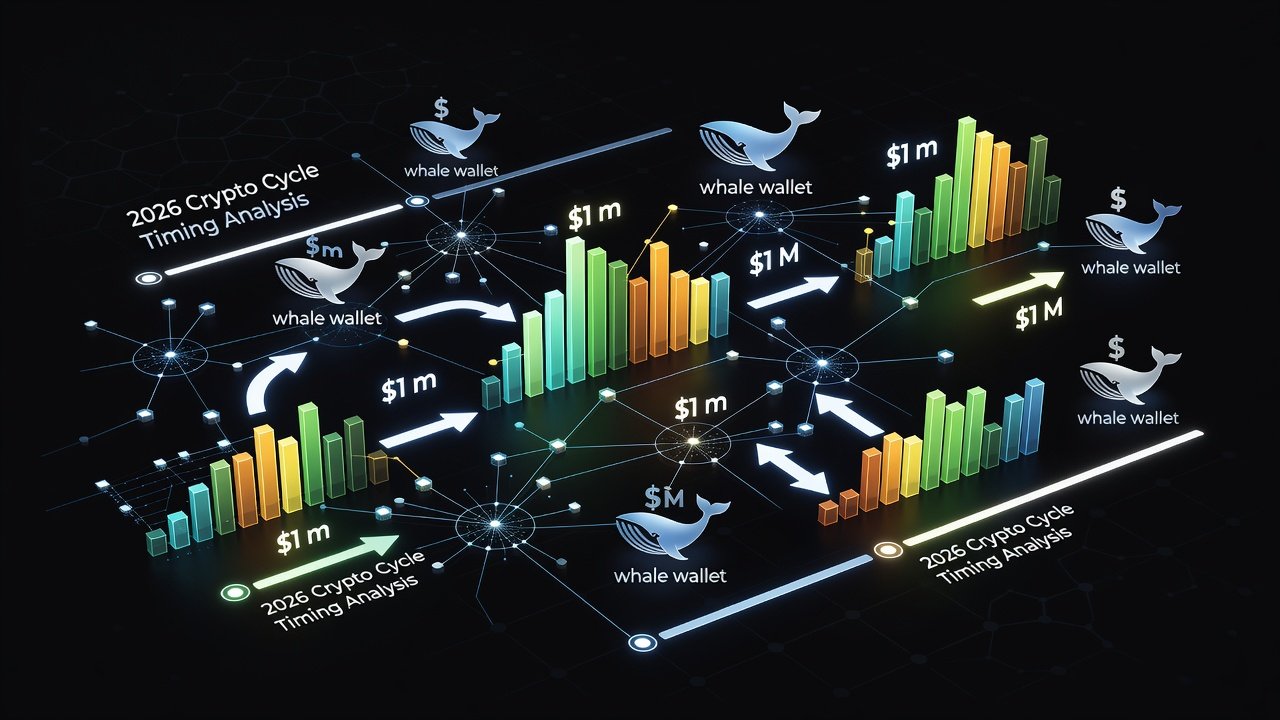
Volume on-chain tracks the actual movement of assets across blockchains, distinguishing between speculative trading and genuine accumulation. Critical metrics include exchange inflow/outflow volumes, realized volume, and whale transaction counts. Liquidity metrics such as order book depth on major exchanges complement these by showing how easily large positions can be executed without slippage. Realized volume specifically measures coins moved at their last acquisition price, highlighting whether holders are realizing gains or losses. Whale transaction counts above certain thresholds, typically $1 million or more, often precede major shifts as large entities reposition portfolios.
Traders should monitor daily active addresses alongside volume to confirm whether spikes represent organic interest or coordinated activity. Exchange reserve levels provide additional context, with declining reserves typically signaling accumulation as coins leave trading platforms. This combination filters noise effectively during volatile periods. Cross-referencing multiple metrics reduces false signals that single indicators might generate, especially in altcoin markets where liquidity can be thinner than Bitcoin or Ethereum.
Practical Application of Metrics
For example, a sudden rise in realized volume paired with stable exchange outflows suggests long-term holders are accumulating rather than selling. In 2026, integrating these with layer-2 scaling solutions on Ethereum will be essential as transaction costs drop and on-chain activity increases across networks.
Step-by-Step Framework for Spotting Accumulation Phases
- Track sustained exchange outflows exceeding inflows over 7-14 days, indicating coins moving to cold storage and reducing immediate sell pressure.
- Analyze whale wallet clusters for consistent buying below key moving averages without corresponding price pumps, which often indicates stealth accumulation by sophisticated players.
- Cross-reference with realized volume increases that outpace spot trading volume on derivatives platforms, confirming genuine holder conviction.
- Confirm low volatility in funding rates alongside rising on-chain transfer volumes to ensure the move is not driven by leveraged speculation.
- Validate against historical cycle baselines to assess whether current patterns align with past successful accumulation periods.
Apply this framework sequentially to avoid false positives from temporary market noise. Document each step in a trading log for later review and refinement of the process.
Identifying Distribution Phases with Volume Data
Distribution phases show the opposite: rising exchange inflows paired with declining on-chain velocity. Whale activity often clusters around resistance levels, with large transfers to exchanges preceding sell-offs. Monitoring these patterns helps traders anticipate exits before momentum reverses. Additional signs include increasing realized volume during price plateaus, suggesting profit-taking by early holders.
Compare current flows against historical baselines from prior cycles to gauge intensity. Elevated inflow volumes during low retail participation frequently precede corrections, giving advanced warning for position adjustments.
Bull Versus Bear Volume Patterns: Practical Comparisons
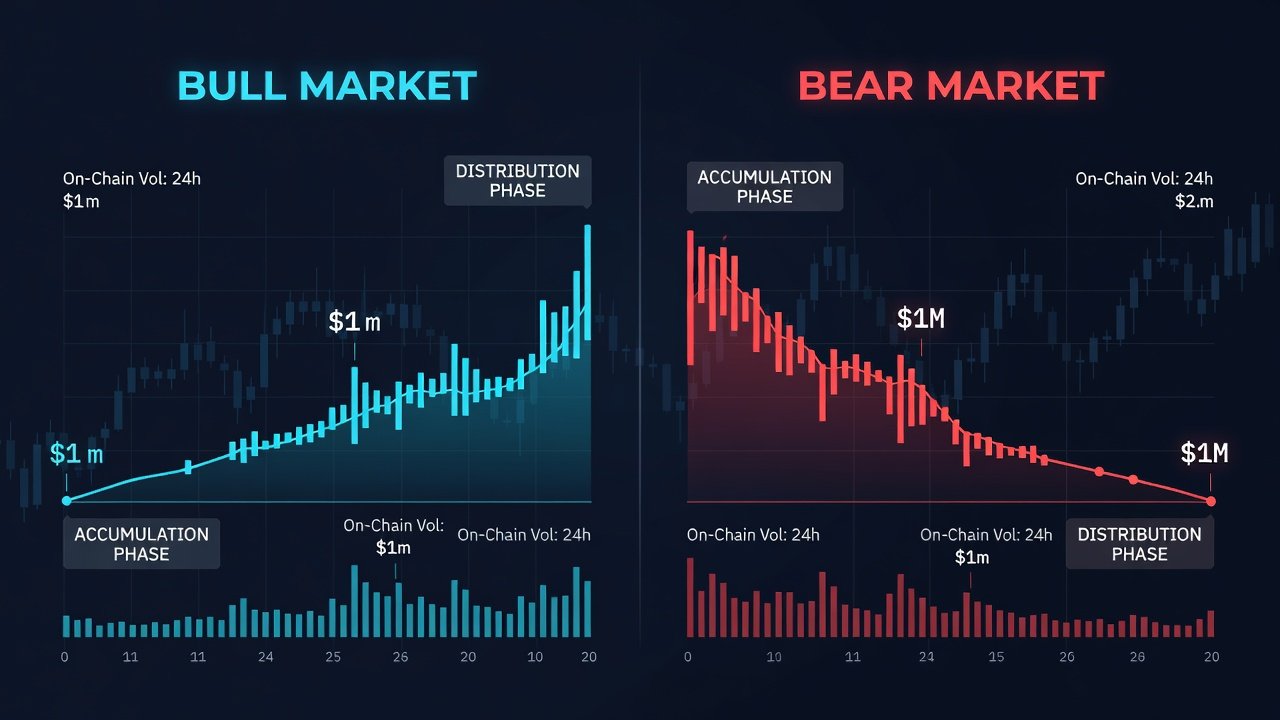
Bull market volume patterns feature expanding on-chain activity with balanced exchange flows and increasing whale accumulation during dips. Bear phases display contracting volume, heavy exchange deposits, and whale distribution at local tops. In 2026, expect amplified differences due to institutional participation, making volume divergences more pronounced and easier to detect with modern dashboards.
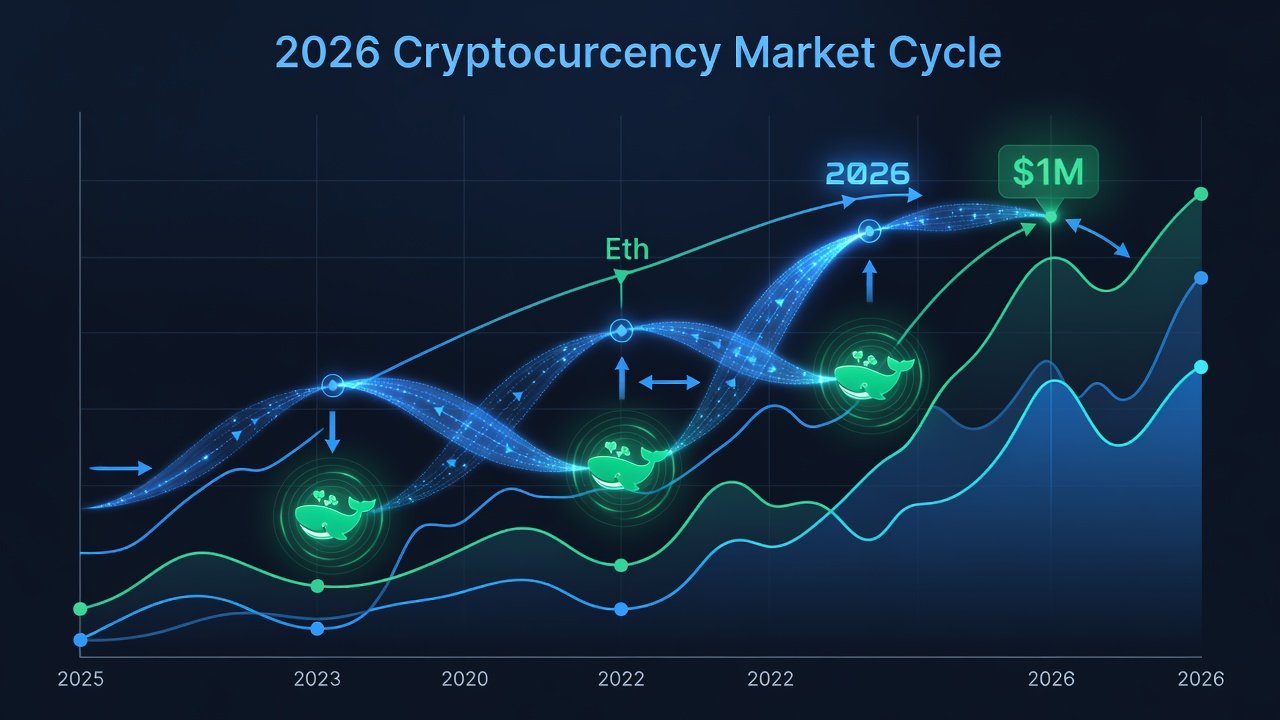
Real-world case studies from 2020-2021 show how Bitcoin's on-chain volume spikes during accumulation preceded the 2021 rally, while 2022 distribution saw consistent inflows ahead of the bear market bottom. The 2017 bull run similarly demonstrated rising whale activity coinciding with exchange outflows before the peak. Applying these to current 2026 trends suggests monitoring similar divergences in Ethereum and major altcoins, where layer-2 adoption could accelerate volume signals. Chainalysis reports on institutional flows provide further context for interpreting these patterns in real time.
Risk-Adjusted Exit Rules
Exit rules should incorporate volume confirmation: reduce positions when exchange inflows spike above 30-day averages without corresponding demand metrics. Use trailing stops tied to realized volume drops to protect gains during distribution. Always allocate risk in tiers, exiting 25-50% on initial volume warnings and the remainder on confirmed breakdowns. Scenario planning helps here. For instance, if inflows rise sharply but price holds, consider partial profit-taking while keeping core holdings intact. Re-enter only after outflows resume and volume normalizes. This tiered approach minimizes emotional decisions and preserves capital across multiple cycles.
Actionable Checklists for Daily Analysis
- Review exchange net flows from at least three major platforms each morning, noting any anomalies exceeding two standard deviations from the mean.
- Scan whale transaction alerts for clusters above $1M in value and map them to known wallet behaviors.
- Compare 7-day and 30-day volume moving averages for divergences that may indicate phase shifts.
- Log observations in a trading journal with timestamped screenshots and supporting metric values for future backtesting.
- Reassess positions weekly against the full framework, adjusting exposure based on confluence across metrics.
- Cross-check on-chain signals with broader market liquidity indicators to confirm tradable setups.
Common Pitfalls to Avoid
Many traders over-rely on single exchange data, missing multi-platform flows that provide the complete picture. Another frequent error is ignoring context from macro events that temporarily distort volume readings. Avoid entering solely on volume spikes without confirming liquidity depth, as thin books can lead to rapid reversals and slippage. Overlooking dormant wallet reactivation can also mislead analysis, since sudden movements from long-held coins often signal distribution. Finally, failing to update thresholds as market maturity increases in 2026 may result in outdated signals.
FAQ: Integrating On-Chain Tools into Daily Routines
How often should I check on-chain dashboards? Daily reviews suffice for most intermediate traders, with deeper analysis twice weekly during high-volatility periods to catch early phase changes.
Which platforms provide the best free volume data? Start with public explorers and upgrade to professional tools as portfolio size grows, ensuring data accuracy across multiple chains.
Can these frameworks apply to altcoins? Yes, but adjust thresholds for lower liquidity assets using relative comparisons rather than absolute numbers.
What if volume data conflicts with price action? Prioritize on-chain signals during accumulation, as they often lead price by days or weeks, allowing for better entry timing.
How do I combine these tools with other analysis methods? Blend on-chain volume with technical levels and sentiment indicators for higher conviction trades, always maintaining a risk-first mindset.
Conclusion
Mastering 2026 crypto entries through on-chain volume frameworks equips traders with an edge in spotting phases early. Combine these tools with disciplined risk management for consistent results across cycles. Regular practice turns these metrics into intuitive decision support that improves over time.
No comments yet. Be the first!