 CryptoChain Blog
Introduction to On-Chain Volume Signals for 2026
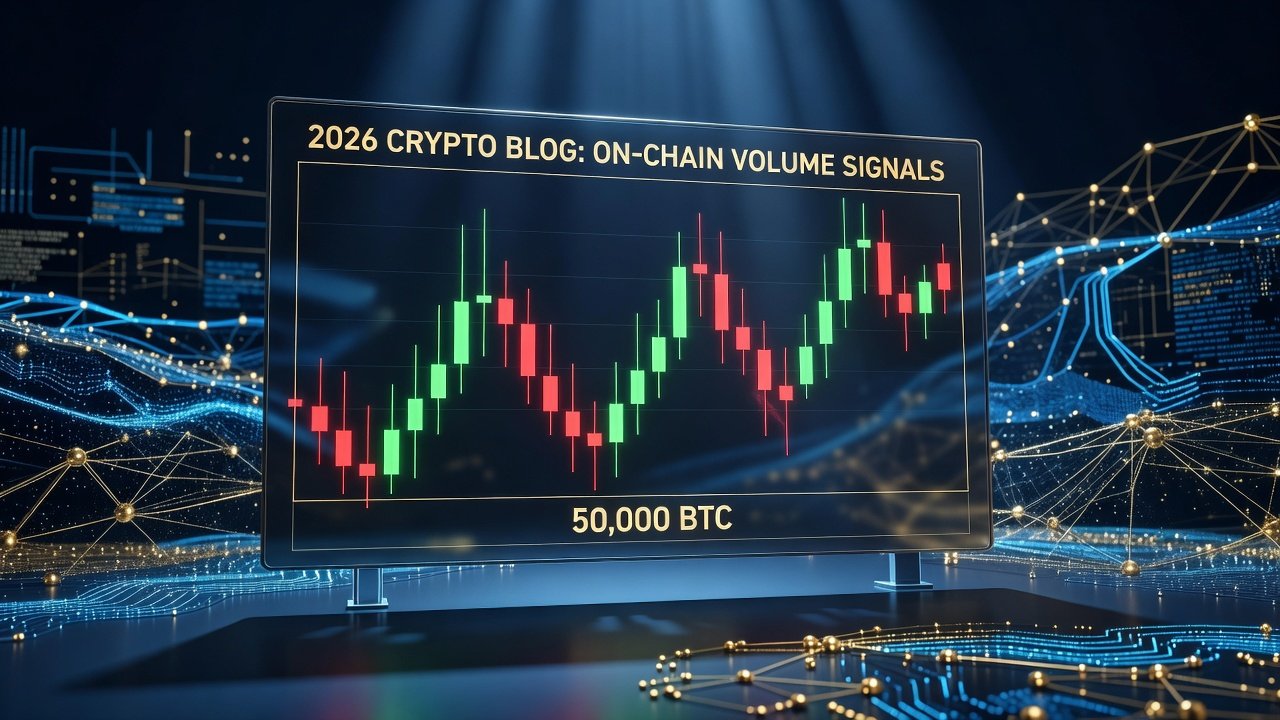
Navigating cryptocurrency market cycles in 2026 requires more than price charts alone. On-chain volume signals provide data-driven insights into investor behavior, helping traders identify accumulation phases, distribution points, and potential reversals. These metrics reveal real economic activity on blockchains, offering an edge over traditional technical analysis by showing actual transaction flows rather than just market sentiment derived from order books.
By focusing on exchange inflows, realized volume patterns, and funding rate divergences, investors can refine entry and exit decisions. This approach builds on proven market cycle mastery techniques while incorporating fresh data perspectives for the current cycle. Understanding these signals becomes especially critical in 2026 as institutional participation grows and liquidity dynamics shift rapidly across Bitcoin, Ethereum, and major altcoins.
Key On-Chain Metrics Explained
Exchange Inflows and Outflows
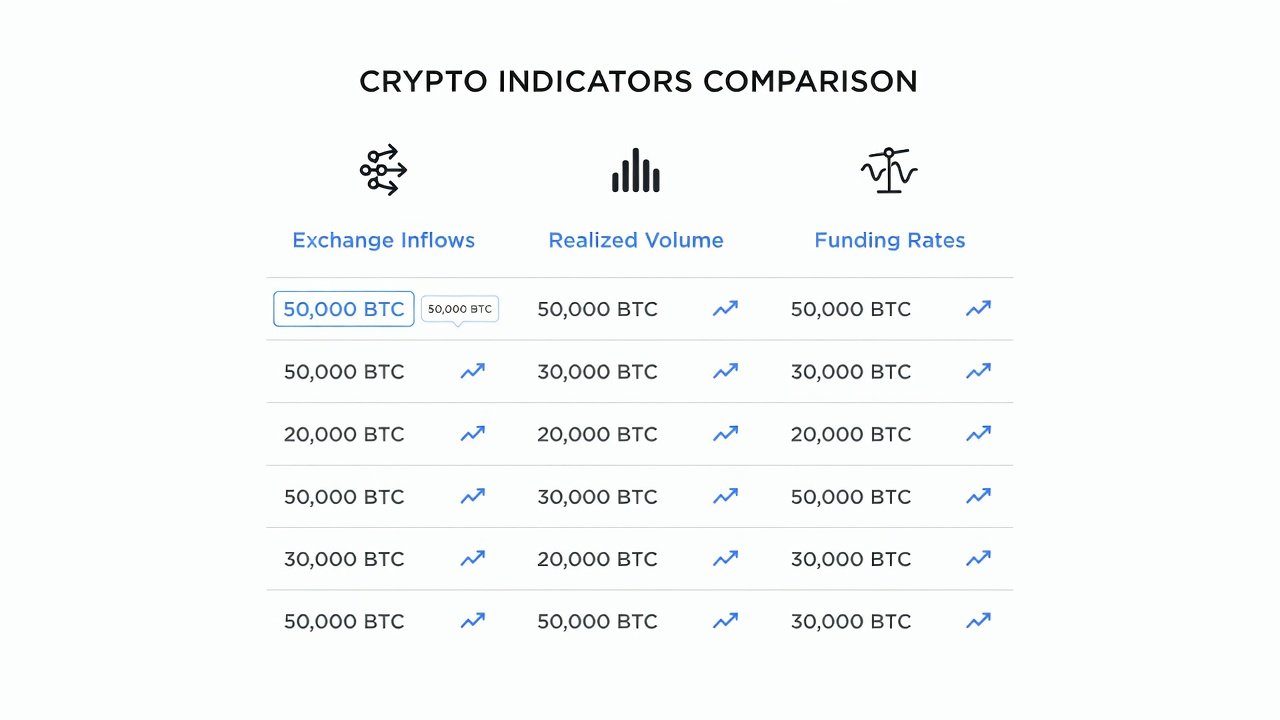
Exchange inflows often signal potential selling pressure as holders move assets to trading platforms. Large clusters of inflows frequently precede increased volatility because they indicate coins are being prepared for sale or leveraged trading. Conversely, outflows to private wallets indicate accumulation by long-term holders who prefer self-custody. Monitoring these flows helps anticipate short-term volatility during bull and bear transitions. Traders should track both absolute volumes and the speed of movements, as sudden spikes above average daily levels often mark turning points.
Realized Volume Patterns
Realized volume tracks the actual value transferred on-chain, adjusted for repeated movements. Unlike spot trading volume, realized volume filters out wash trading and focuses on economically meaningful transfers. Spikes in realized volume during price rallies can confirm trend strength, while divergences where price rises but realized volume falls may warn of weakening momentum. In practice, sustained realized volume growth above 20-day moving averages has historically aligned with healthy bull market continuations.
Funding Rate Divergences
Funding rates on perpetual futures contracts reflect market sentiment between long and short positions. Extreme positive rates often coincide with over-leveraged long positions, increasing correction risk as liquidations cascade. Negative rates can highlight capitulation opportunities where shorts are overcrowded. Divergences between funding rates and spot on-chain activity provide especially powerful signals because they reveal when derivatives markets detach from underlying blockchain fundamentals.
Step-by-Step Framework for Interpreting Signals
- Collect data from multiple on-chain sources and normalize for market cap changes to avoid bias from overall market growth.
- Identify baseline ranges during previous cycles for comparison, focusing on 30-day and 90-day averages.
- Look for confluence across at least two metrics before acting, such as rising inflows paired with extreme funding rates.
- Apply risk filters such as position sizing based on signal strength, reducing exposure when only one metric flashes.
- Monitor for false signals by cross-referencing with macroeconomic events like interest rate announcements or regulatory news.
- Document every trade decision with the exact signals used to build a personal performance log over time.
Practical Examples from Recent Bull and Bear Phases
During the 2024 bull run, rising exchange outflows paired with stable realized volume supported continued upward movement until funding rates turned excessively positive above 0.05 percent on major exchanges. This combination allowed observant traders to begin scaling out positions weeks before the local top. In the subsequent bear phase of early 2025, heavy inflows exceeding 50,000 BTC in a single week preceded major drawdowns, allowing prepared investors to reduce exposure early and preserve capital. Another example occurred in mid-2025 when realized volume dropped sharply while price held steady, foreshadowing a liquidity squeeze that resolved with a 25 percent correction across altcoins. These cases demonstrate how combining multiple signals reduces false positives compared to relying on any single metric.
Risk-Adjusted Allocation Tactics
Successful timing involves scaling positions gradually rather than all-in entries. Allocate 30-50 percent of capital on strong confluence signals, with trailing stops tied to volume reversals. Diversify across Bitcoin, Ethereum, and select altcoins while maintaining cash reserves for dips. Consider using tiered allocation where the strongest signals receive larger position sizes and weaker but still positive signals receive smaller allocations. Rebalance quarterly to lock in gains and avoid overexposure during prolonged trends. Always define maximum drawdown limits in advance, such as exiting 50 percent of a position if two key metrics flip bearish simultaneously.
Comparison of Indicator Reliability
| Indicator | Reliability in Bull Markets | Reliability in Bear Markets | Best Used With |
|---|---|---|---|
| Exchange Inflows | High | Medium | Funding Rates |
| Realized Volume | Medium | High | Price Action |
| Funding Rate Divergences | High | High | On-Chain Flows |
| Combined Metrics | Very High | Very High | Macro Data |
Setting Up Free Dashboards for Beginners
Start with platforms offering free tiers for on-chain data visualization. Connect wallet addresses and set alerts for key thresholds such as exchange inflow spikes above the 90-day average. Regularly review tutorials on data interpretation to avoid common misreads of raw numbers. Build a simple dashboard that displays exchange flows, realized volume, and funding rates side by side. Test the setup during low-volatility periods before relying on it for live decisions. Many free tools also allow CSV exports so you can perform custom calculations in spreadsheets. Consistent daily review, even for just 15 minutes, builds intuition for normal versus abnormal patterns over time.
Common Pitfalls and How to Avoid Them
- Over-reliance on a single metric without confirmation from others.
- Ignoring broader market context such as regulatory developments or macroeconomic shifts.
- Entering or exiting too late because signals are lagging by nature.
- Failing to account for exchange-specific behaviors where some platforms show inflated volumes.
FAQ: Common Timing Mistakes to Avoid
How do I avoid overreacting to single signals?
Always require confirmation from multiple metrics and consider broader market context before reallocating portfolios.
What is the biggest mistake in using funding rates?
Ignoring extreme readings until after a reversal has already begun, leading to late entries or exits that reduce overall returns.
Can these signals work for altcoins as well as Bitcoin?
Yes, but altcoin signals require additional filters because lower liquidity can create noisier on-chain data compared to major assets.
How often should I check my dashboard?
Daily monitoring is sufficient for most investors, with deeper weekly reviews to identify emerging trends across multiple timeframes.
Conclusion
Integrating on-chain volume signals into your 2026 strategy enhances cycle timing precision. Consistent application of these frameworks, combined with disciplined risk management, positions investors for better outcomes across volatile crypto markets. Resources such as Glassnode, DefiLlama, and CoinMetrics provide excellent starting points for deeper research and ongoing education.


No comments yet. Be the first!