 CryptoChain Blog

Introduction to On-Chain Cycle Analysis in 2026
Cryptocurrency markets in 2026 continue to exhibit pronounced cyclical behavior driven by macroeconomic shifts, institutional adoption, and technological upgrades. Mastering timing requires moving beyond simple price trends to combine multiple on-chain signals into a cohesive framework. This approach helps traders identify high-probability entry and exit points while managing volatility. Stacking indicators involves layering complementary data sources—on-chain fundamentals, volume patterns, and momentum oscillators—to confirm cycle phases. When used correctly, this method reduces false signals and improves risk-adjusted returns across bull and bear markets. In an environment where retail and institutional participants compete for alpha, relying on isolated metrics often leads to suboptimal decisions. Instead, a stacked methodology provides confluence that has historically improved accuracy in identifying accumulation, distribution, and transition phases.
The goal of this guide is to deliver a practical, step-by-step system tailored for 2026 volatility. Readers will learn how to source reliable data, interpret combined signals, apply risk rules, and construct sample portfolios. Whether you are a seasoned trader or an intermediate analyst, the framework emphasizes discipline over prediction.
Key On-Chain Metrics for Cycle Detection
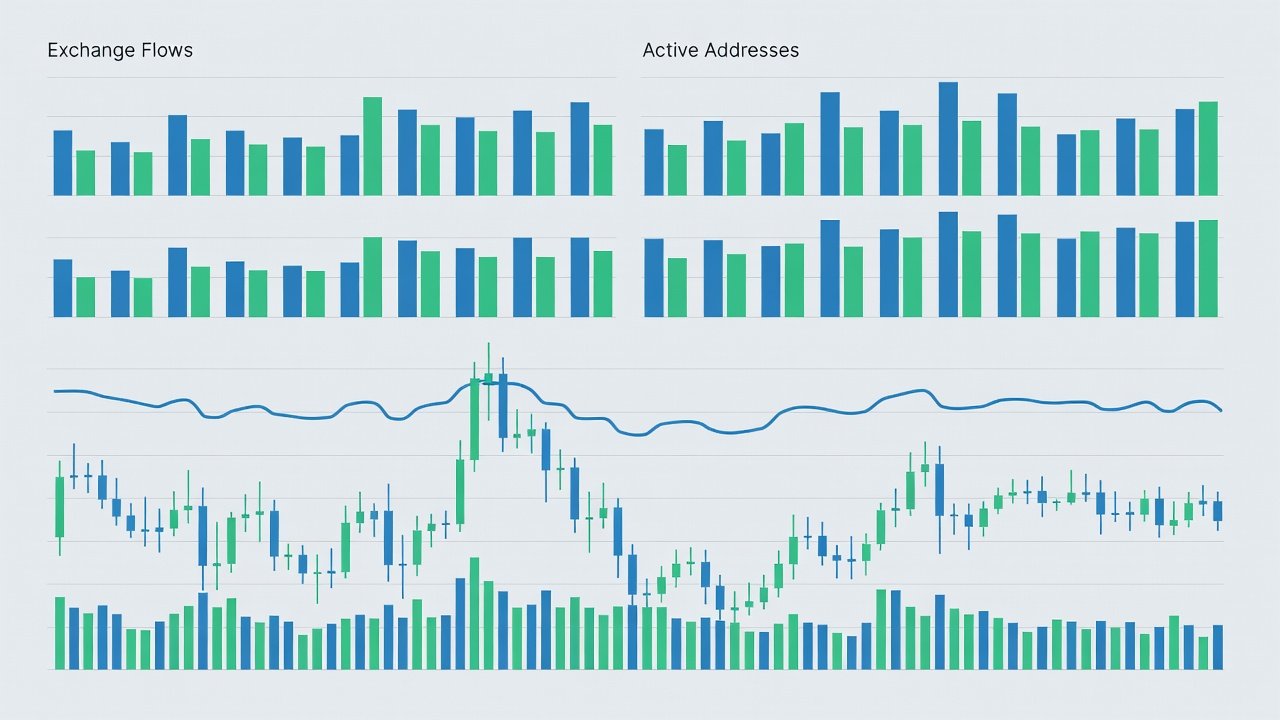
Exchange flows represent one of the most reliable signals. Large inflows to centralized exchanges often precede selling pressure, while outflows suggest accumulation by long-term holders. Active addresses provide insight into network usage and adoption trends, with sustained growth typically aligning with expansion phases of the cycle. Additional metrics such as realized price, MVRV ratios, and long-term holder supply further refine the picture. These data points are publicly accessible through platforms that aggregate blockchain information. Exchange flow data reveals whether coins are moving toward or away from liquid venues, offering early clues about holder intent. Active address counts, when smoothed over 30-day periods, filter out short-term noise and highlight genuine usage growth. Realized price acts as a dynamic on-chain support level, while MVRV helps quantify whether current valuations sit in historically overvalued or undervalued zones.
Step-by-Step Framework for Indicator Stacking
- Start with exchange flow analysis: Monitor 7-day and 30-day moving averages of BTC and ETH inflows. Consistent inflows above historical norms signal distribution.
- Layer active address trends: Cross-reference with daily active addresses. Rising addresses during outflows strengthen bullish confirmation.
- Incorporate volume patterns: Look for volume spikes coinciding with breakout attempts above key resistance levels.
- Add momentum oscillators: Apply RSI and MACD on weekly timeframes to identify overbought or oversold conditions that align with on-chain shifts.
- Generate composite signals: Require at least three of four metrics to align before executing trades.
This sequential process creates a robust filter that filters out noise common in single-indicator strategies. Each step builds upon the previous one, creating a decision tree that traders can follow mechanically. For example, if exchange flows show outflows but active addresses remain flat, the composite signal stays neutral until additional confirmation arrives from volume or momentum.
Real Market Scenarios and Application
Consider a hypothetical 2026 mid-cycle correction where exchange inflows rise sharply while active addresses plateau. When combined with declining volume and RSI dropping below 50, this stacked signal would have flagged a defensive posture. Conversely, during recovery phases, outflows paired with rising addresses and expanding volume often precede sustained rallies. Traders who applied similar logic in prior cycles successfully navigated both the 2024-2025 accumulation and subsequent expansion periods. Another scenario involves a post-halving environment where long-term holder supply increases alongside falling exchange reserves. When momentum oscillators turn positive and volume expands on up-days, the stacked setup supports gradual position building rather than all-in entries. These examples illustrate how confluence across metrics reduces emotional decision-making during uncertain periods.
Bitcoin.org offers foundational resources on blockchain data interpretation that complement these techniques.
Risk-Adjusted Entry and Exit Rules
Position sizing should reflect signal strength. Allocate larger portions only when all stacked indicators align. Use stop-losses placed below recent swing lows confirmed by on-chain support levels. Profit targets can be scaled using partial exits at predetermined Fibonacci extensions or when opposing signals emerge. Always maintain a maximum portfolio risk of 1-2% per trade regardless of conviction level. Traders should also track correlation between assets; when multiple altcoins show identical stacked signals, diversification across uncorrelated holdings becomes essential to avoid concentrated drawdowns. Rebalancing occurs only on confirmed composite shifts, preventing over-trading.
Simple Versus Advanced Stacking Approaches
Simple stacking relies on two or three core metrics and works well for beginners seeking clarity. Advanced methods incorporate machine learning overlays, multi-asset correlations, and on-chain derivatives data such as funding rates. The advanced route demands more technical infrastructure but can capture nuanced divergences missed by basic models. Most retail participants achieve strong results with the simple framework while gradually adding complexity as experience grows. Advanced users often integrate funding rate data from perpetual futures markets to detect leverage-driven exhaustion before it appears in spot on-chain metrics.
Portfolio Examples for 2026 Cycles
- Conservative allocation: 60% BTC, 30% ETH, 10% stablecoins, rebalanced on stacked sell signals.
- Moderate allocation: 40% BTC, 35% ETH, 15% select altcoins, 10% stablecoins with active rebalancing.
- Aggressive allocation: 30% BTC, 25% ETH, 30% altcoins, 15% stablecoins, using leverage only on highest-conviction stacked buy signals.
Tools and Data Sources for Implementation
Accessing accurate on-chain data requires reliable platforms. Public explorers and analytics dashboards provide the raw inputs needed for stacking. Cross-verifying metrics across multiple providers reduces the risk of data anomalies. Integrating these feeds into spreadsheets or lightweight scripts allows automated alerts when composite thresholds are met. Ethereum.org supplies additional context on network health metrics that pair well with Bitcoin-focused indicators.
FAQ: Common Timing Pitfalls
How do I avoid over-optimization of indicators?
Test frameworks across multiple market regimes rather than curve-fitting to recent data. Out-of-sample validation prevents this common error.
Should I rely solely on on-chain data?
No. Always integrate macroeconomic context and sentiment analysis to avoid blind spots during black-swan events.
What timeframes work best for stacking?
Daily and weekly charts provide the clearest signals for cycle-level decisions, while intraday data suits tactical adjustments.
How frequently should signals be reviewed?
Weekly reviews strike the optimal balance between responsiveness and avoiding over-trading noise.
Can stacking be applied to altcoins beyond BTC and ETH?
Yes, but adjust thresholds for lower liquidity and higher volatility. Require stronger confluence before acting on altcoin signals.
Conclusion
Stacking on-chain indicators with volume and momentum tools equips traders with a durable edge for navigating 2026 volatility. By following the structured framework, applying disciplined risk rules, and continuously refining the approach, market participants can improve timing precision and portfolio resilience. Consistent application across cycles remains the key differentiator between average and exceptional results.

No comments yet. Be the first!