 CryptoChain Blog
Introduction to Ethereum Layer 2 Metrics in 2026
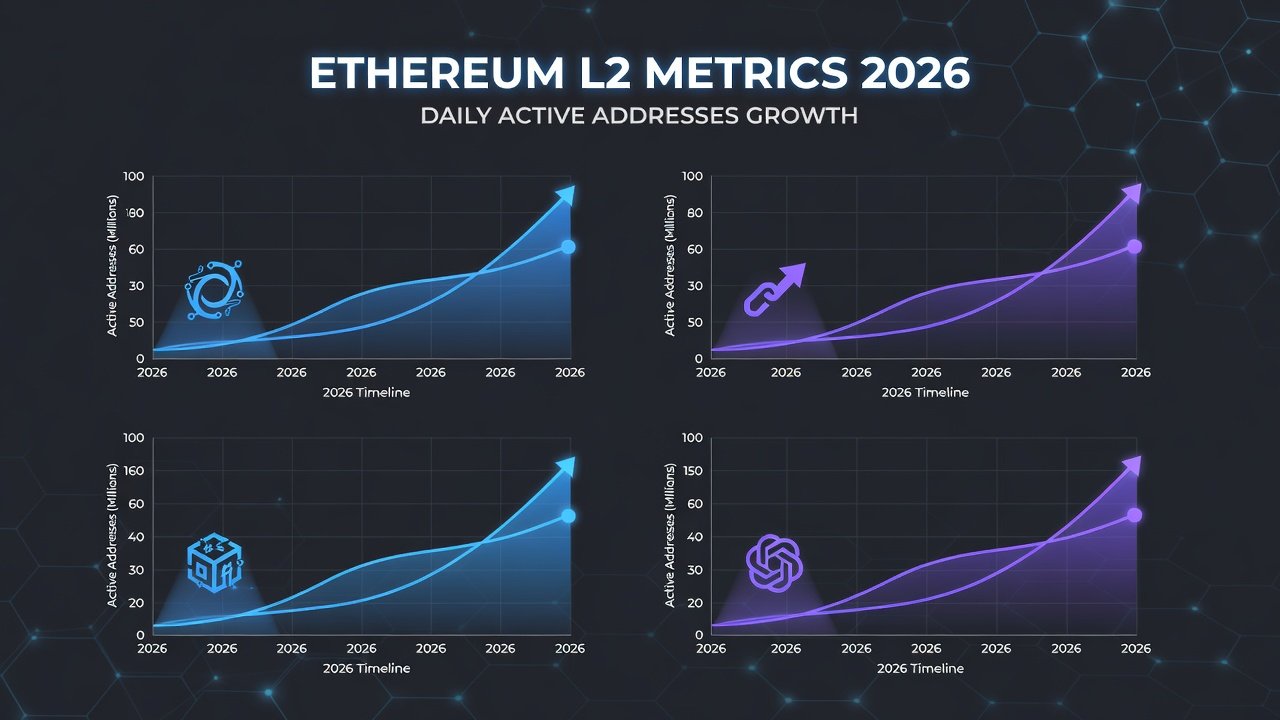
Ethereum Layer 2 solutions have become the backbone of scalable blockchain activity by 2026. With mainnet congestion persisting, rollups handle the majority of transactions while inheriting Ethereum's security. This article examines key metrics including daily active addresses, transaction volumes, and retention rates across optimistic and zero-knowledge rollups, drawing from L2Beat and Dune Analytics. Investors and developers need reliable data to identify sustainable momentum amid rapid ecosystem evolution. Understanding these metrics allows stakeholders to separate hype from genuine adoption, focusing on chains that demonstrate consistent user growth rather than short-term spikes driven by airdrop farming.
Ethereum L2 Landscape Overview
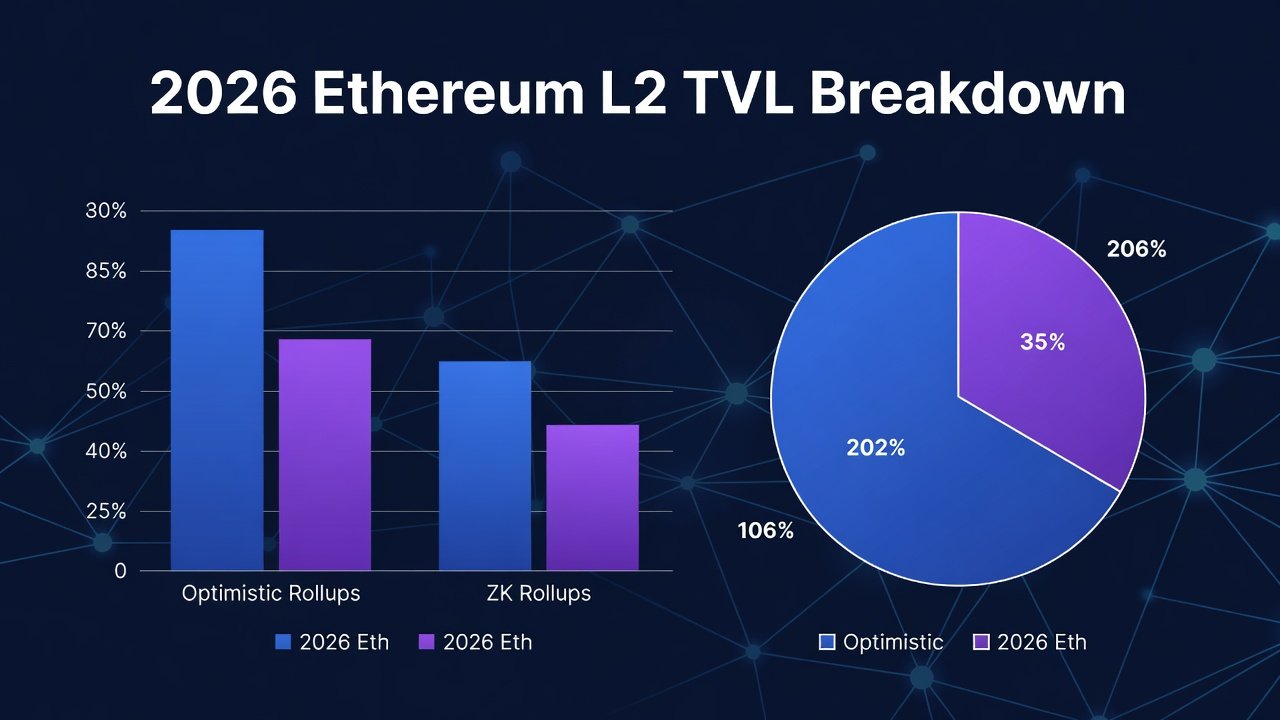
The L2 ecosystem in 2026 features a mix of optimistic rollups like Arbitrum and Optimism alongside ZK rollups such as zkSync and emerging players. Base has gained significant traction through its Coinbase backing. Total value locked and address activity reflect broader adoption trends, with L2s collectively processing millions of daily transactions. Growth has been fueled by improvements in account abstraction, which simplifies onboarding for new users, and enhanced bridge infrastructure that reduces friction when moving assets between chains. Data from L2Beat shows that combined L2 activity often surpasses Ethereum mainnet by a factor of ten or more during peak periods, highlighting the shift toward layer-two scaling solutions.
Daily Active Addresses Analysis
Daily active addresses serve as a primary indicator of genuine user engagement rather than bot-driven activity. Data from Dune Analytics dashboards reveal steady growth across major L2s, with spikes during DeFi seasons and NFT launches. For example, monitoring address cohorts over multiple months helps reveal whether new users return after initial interactions. Address quality metrics help distinguish between one-time users and retained participants. Metrics such as repeat address interaction rates and average transaction count per address provide deeper insights into ecosystem health. High-quality addresses often correlate with meaningful economic activity, such as liquidity provision or repeated gaming sessions, rather than simple token transfers. Analysts recommend tracking addresses that interact with at least three distinct smart contracts to filter out low-value noise.
Transaction Volumes and User Retention
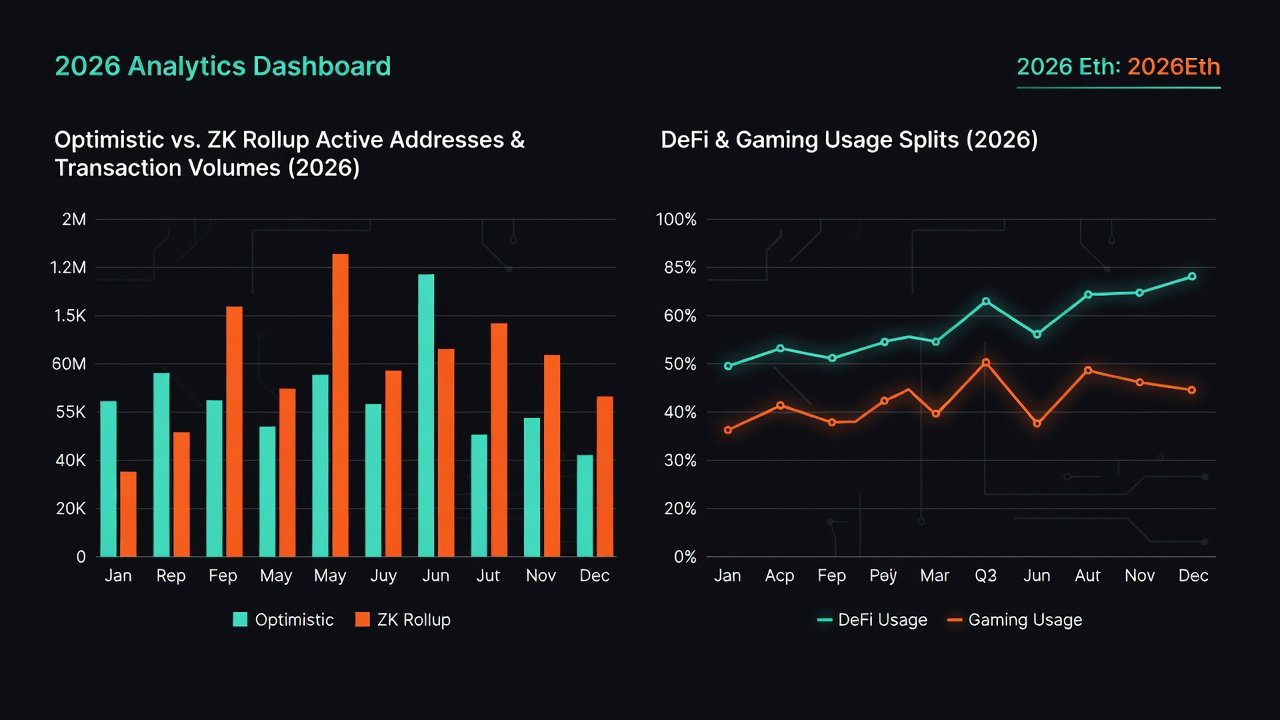
Transaction volumes on L2s have scaled dramatically, often exceeding Ethereum mainnet by orders of magnitude. Retention is measured through cohort analysis showing the percentage of addresses remaining active after 30 or 90 days. Optimistic rollups generally show higher initial volumes, while ZK rollups excel in retention due to lower fees and faster finality in certain use cases. Practical examples include tracking how users who bridged assets during a bull run continue transacting months later. Retention dashboards on Dune often break down activity by transaction type, revealing that gaming users tend to exhibit higher frequency but lower per-transaction value compared to DeFi participants. Sustainable chains demonstrate retention rates that improve over time rather than declining after incentive programs end.
Optimistic vs ZK Rollups Comparison
- Optimistic rollups (Arbitrum, Optimism, Base): Benefit from EVM compatibility and mature tooling but rely on fraud proofs with 7-day challenge periods. This makes them ideal for applications requiring complex smart contract interactions today.
- ZK rollups (zkSync, Starknet): Offer cryptographic security and instant finality, though proving overhead can impact costs for complex transactions. They shine in scenarios demanding high throughput and privacy features.
- Key differences appear in gas efficiency and developer experience, with optimistic chains often providing easier migration paths for existing Ethereum dApps.
- Hybrid approaches are emerging where projects deploy on multiple rollup types to capture diverse user bases.
Detailed Chain Comparisons: Arbitrum, Optimism, Base, and zkSync
Arbitrum leads in total addresses and DeFi activity, with strong institutional bridges and a robust ecosystem of decentralized exchanges and lending protocols. Optimism emphasizes governance and public goods funding, attracting developers focused on sustainable ecosystem growth through retroactive public goods funding mechanisms. Base drives consumer adoption through integrated wallet experiences and seamless onboarding tied to traditional finance platforms. zkSync focuses on ZK technology advancements and gaming integrations, leveraging zero-knowledge proofs to enable scalable social and play-to-earn applications. Charts from L2Beat illustrate address growth trends, highlighting Base's rapid rise in 2025-2026 and Arbitrum's consistent dominance in absolute numbers. Cross-chain comparisons also reveal varying levels of sequencer decentralization, which impacts long-term resilience against single points of failure.
DeFi vs Gaming Usage Splits
DeFi protocols account for the majority of value-moving transactions, while gaming drives high-frequency, low-value activity. Dune queries show Base and Arbitrum hosting balanced splits, whereas zkSync sees stronger gaming concentration. Specific examples include popular DeFi platforms like decentralized exchanges seeing peak volumes during market volatility, contrasted with blockchain games that maintain steady daily logins even in bear markets. Understanding these splits helps investors assess risk: DeFi-heavy chains may experience sharper volatility tied to token prices, while gaming-focused ecosystems often show more stable address counts but require ongoing content updates to retain players. Migration patterns indicate users frequently move between chains based on where their preferred dApps launch new features or incentives.
Address Quality Metrics and Cross-Rollup Migration
Quality metrics include Sybil resistance indicators and economic activity per address. Cross-rollup migration patterns reveal users shifting toward chains with superior UX or specific dApp ecosystems, often facilitated by bridges and account abstraction. For instance, addresses that start on Arbitrum for lending may later migrate to Base for social features or to zkSync for lower-cost gaming sessions. Tools from Dune Analytics allow filtering for addresses with consistent multi-month activity across ecosystems. High-quality addresses typically show diversified interactions, including both DeFi and non-financial transactions, signaling organic usage rather than speculative farming. Monitoring these patterns provides early signals of which rollups are building sticky user bases.
Institutional Adoption Signals
Institutional interest manifests through custody integrations, enterprise DeFi pilots, and compliance-focused deployments on select L2s. Chains demonstrating regulatory clarity and robust security audits attract more capital inflows. Examples include traditional financial firms exploring tokenized asset settlements on optimistic rollups and gaming studios partnering with ZK chains for scalable player economies. Institutional adoption often correlates with improved liquidity depth and reduced volatility in native tokens. Investors tracking these signals should watch for partnerships with established custodians and announcements of permissioned or hybrid environments that bridge traditional finance with decentralized infrastructure.
2026 Forecasts and Investor Takeaways
Forecasts point to continued address growth of 40-60% year-over-year, driven by account abstraction and improved interoperability. Investors should prioritize L2s with diversified usage, strong retention above 25% at 90 days, and transparent governance. Sustainable momentum favors projects balancing innovation with security. Practical steps include reviewing weekly Dune dashboards for address cohort health, comparing L2Beat rankings for TVL stability, and monitoring developer activity on GitHub repositories tied to each rollup. Diversification across optimistic and ZK solutions can hedge against technological shifts, while focusing on chains with active institutional pilots reduces exposure to purely retail-driven volatility. Long-term holders benefit from observing migration trends to identify emerging winners before broader market recognition.
FAQ on Interpreting L2 Metrics for Portfolio Decisions
How do active addresses differ from unique addresses?
Active addresses track daily engagement, while unique counts measure total reach. Focus on active metrics for momentum signals, as they better reflect ongoing ecosystem vitality rather than one-time curiosity.
What indicates healthy user retention?
Retention rates above 20% after 30 days combined with increasing average transactions per address signal strong product-market fit. Consistent cohort performance over multiple quarters is a stronger indicator than isolated spikes.
Should investors favor optimistic or ZK rollups?
Both have merits; optimistic for immediate DeFi utility and ZK for long-term scalability and security. A balanced portfolio approach often yields better risk-adjusted results by capturing strengths from each category.
How can cross-rollup migration affect investment choices?
Migration toward a specific chain may indicate superior features or incentives, suggesting potential for future growth in activity and token value. Tracking these flows helps anticipate which ecosystems will gain market share.
Data Sources Appendix
Primary sources include L2Beat for TVL and activity rankings, Dune Analytics for custom queries on addresses and volumes, and Ethereum.org for protocol fundamentals. All data referenced reflects snapshots available as of late 2026. Regular monitoring of these platforms enables data-driven decisions in the fast-evolving L2 space.
No comments yet. Be the first!