 CryptoChain Blog
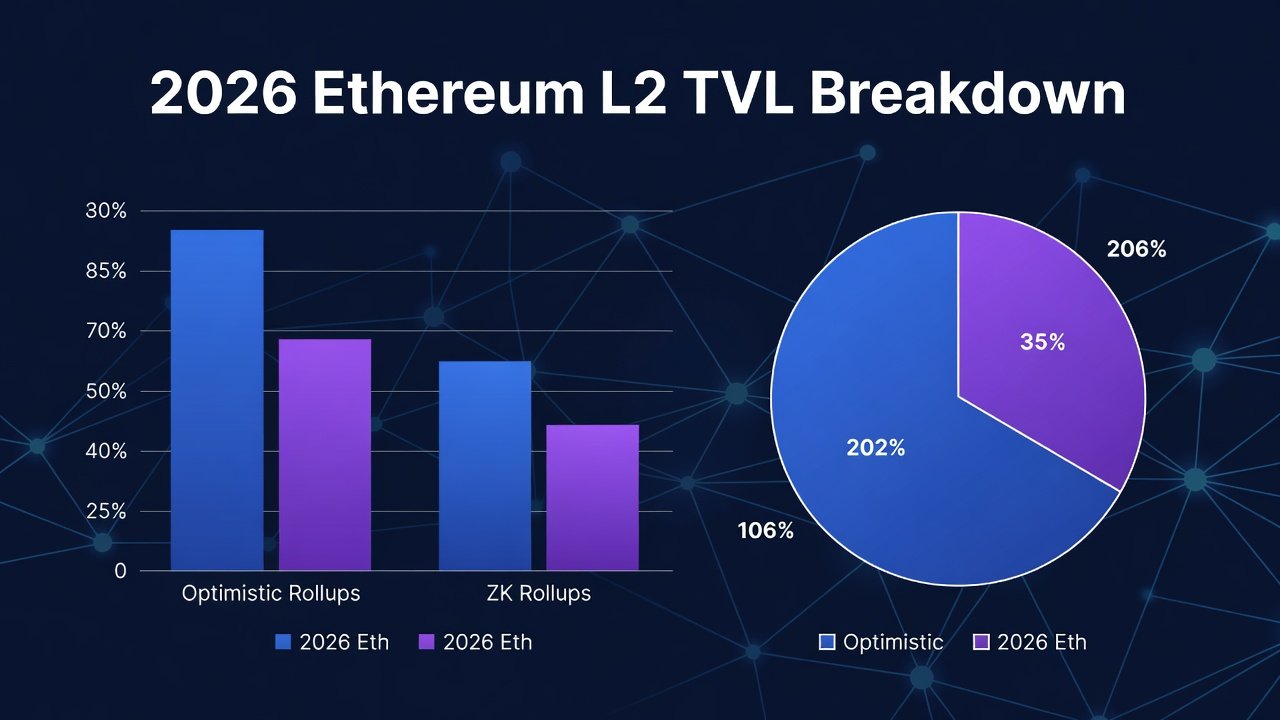
Introduction to 2026 Ethereum L2 Landscape
As Ethereum continues its scaling journey in 2026, Layer 2 solutions remain central to network growth. This analysis breaks down the latest TVL figures, adoption metrics, and institutional interest using fresh data from leading analytics platforms. The Ethereum ecosystem has evolved significantly, with rollups handling the majority of on-chain activity while benefiting from the security of the base layer. Understanding these metrics helps investors, developers, and users navigate opportunities in decentralized finance, gaming, and enterprise applications.
Optimistic rollups and ZK rollups each bring distinct advantages, with TVL serving as a primary indicator of capital commitment alongside rising active addresses and transaction throughput. Recent market conditions have highlighted how external factors like regulatory clarity and macroeconomic trends influence capital allocation across these scaling solutions.
Optimistic vs ZK Rollups: Core Differences in 2026
Optimistic rollups like Optimism and Arbitrum rely on fraud proofs, enabling fast finality with challenge periods. This approach allows for simpler implementation and broader compatibility with existing Ethereum tools. ZK rollups such as zkSync and Polygon zkEVM use zero-knowledge proofs for immediate verification and enhanced privacy. The proof systems provide stronger security guarantees without relying on economic incentives for challengers.
Recent Ethereum network upgrades have amplified both categories, driving differentiated performance in TVL retention and user engagement. Developers often choose based on specific needs such as EVM compatibility for Optimistic solutions or computational efficiency for ZK variants. Both types continue to mature with improved bridging mechanisms and cross-rollup interoperability features.
TVL Trends: Latest Breakdown from L2Beat
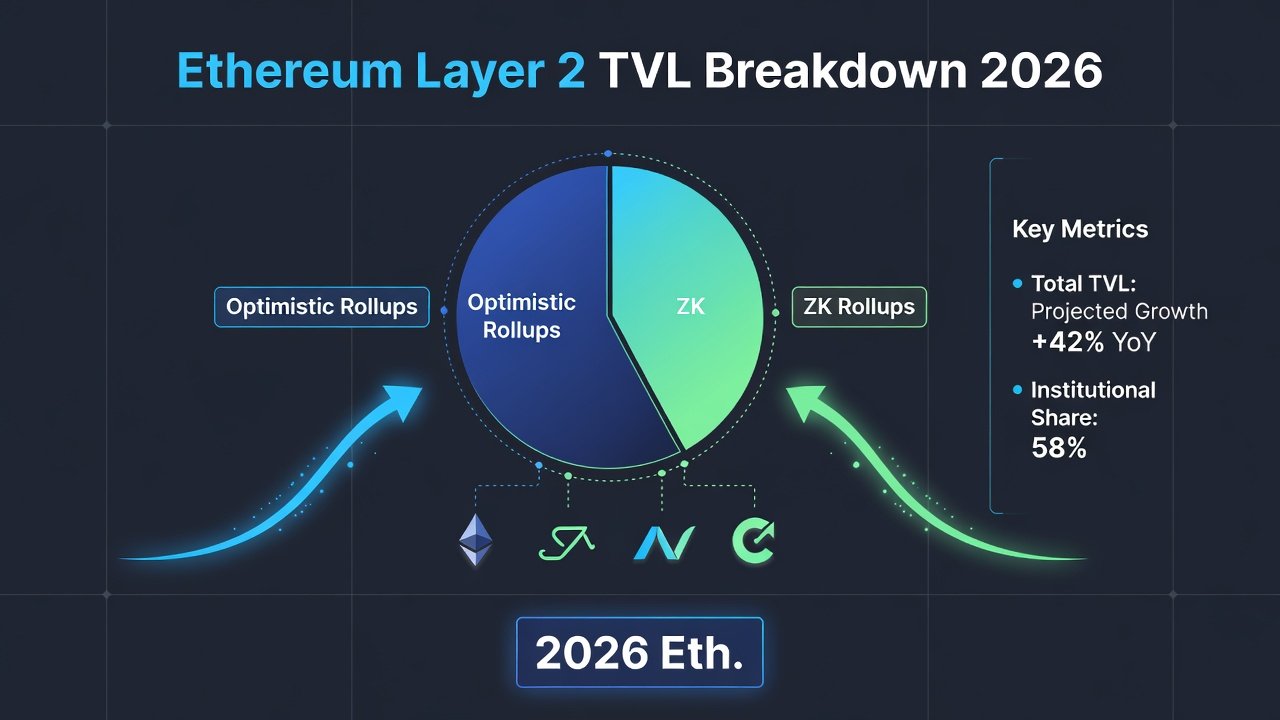
According to L2Beat, total Ethereum L2 TVL has shown steady expansion through late 2026. Optimistic rollups maintain a larger aggregate share due to established DeFi ecosystems, while ZK solutions demonstrate faster percentage growth in specific categories like payments and gaming. These trends reflect ongoing innovation in yield-generating protocols and the migration of liquidity from Layer 1.
Side-by-side comparisons reveal how capital flows respond to security assurances and developer tooling improvements. Factors such as sequencer decentralization and data availability solutions play increasing roles in attracting long-term TVL commitments from both retail and institutional participants.
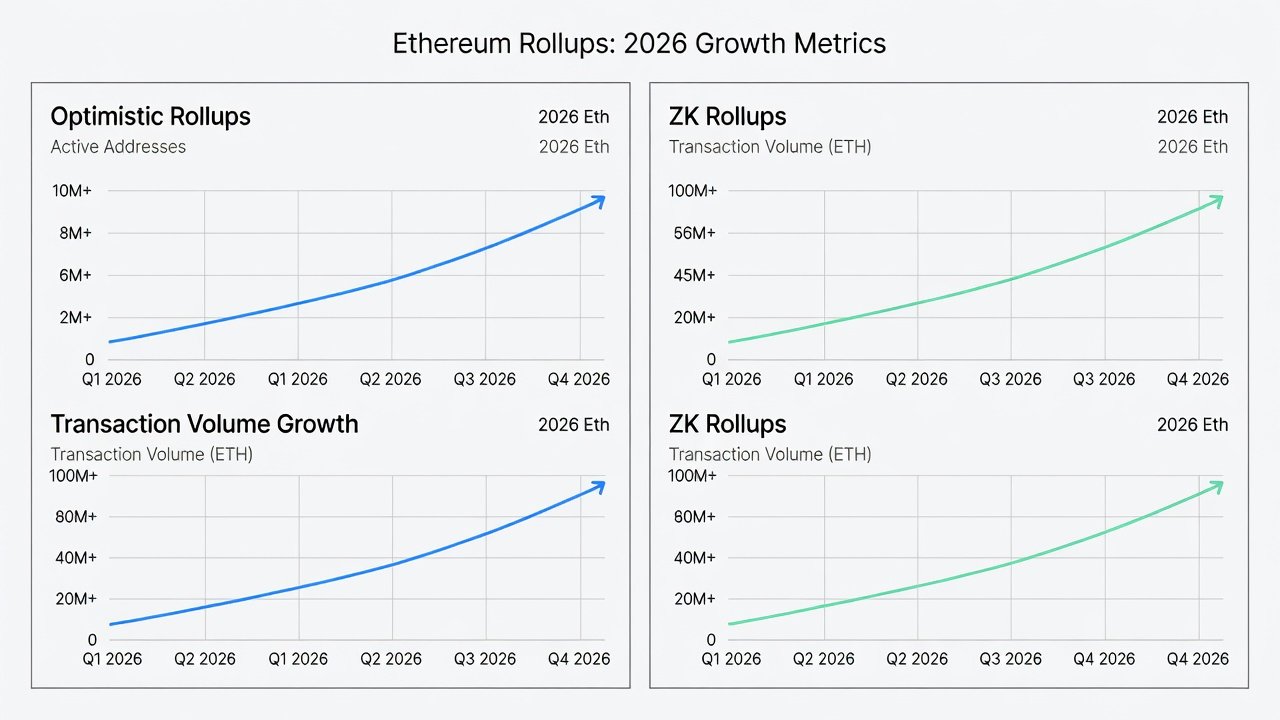
Detailed Category Comparisons
Within DeFi, lending protocols on Optimistic rollups have captured substantial portions of TVL through established integrations. ZK rollups excel in high-frequency trading applications where proof verification reduces settlement times. Tracking these category-level shifts provides deeper insight than aggregate TVL alone.
Active Address Growth and Transaction Volumes
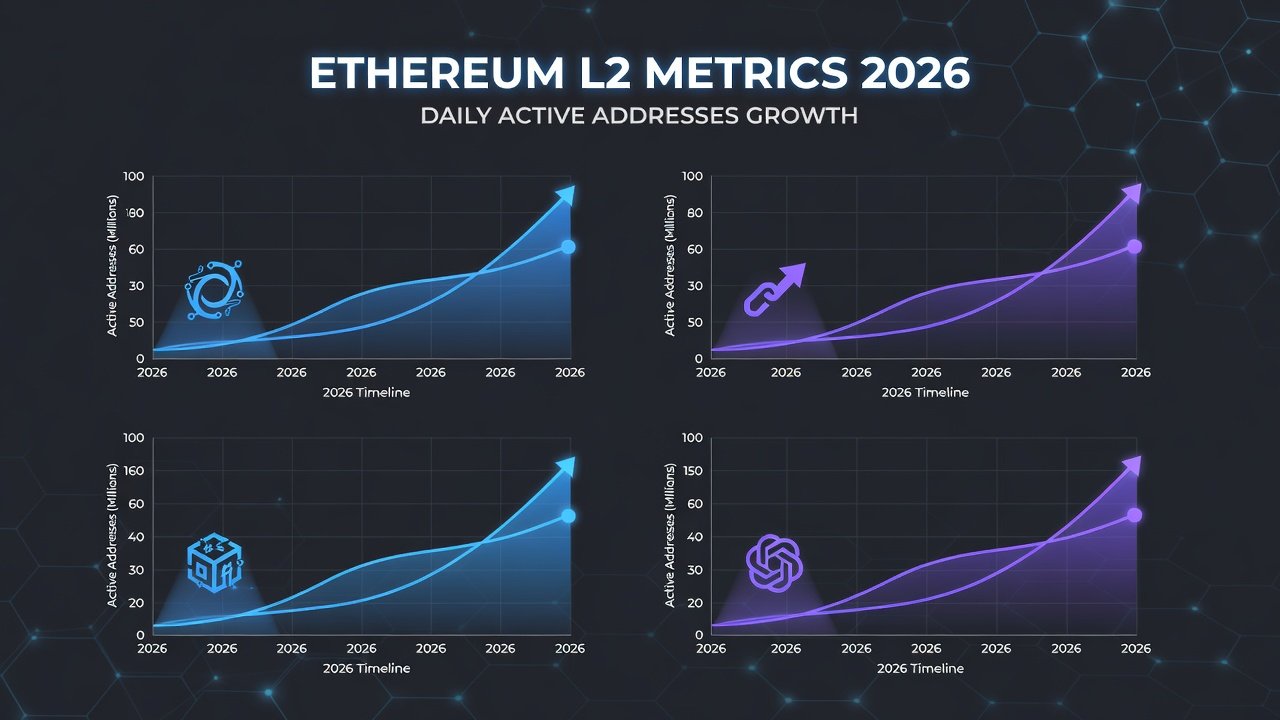
Dune Analytics dashboards highlight pronounced increases in daily active addresses across leading L2s. Transaction volumes have surged in response to lower fees and improved user experiences, with ZK rollups often leading in per-transaction efficiency metrics. These patterns indicate broader network effects as more users migrate from Layer 1 for routine interactions such as token swaps and NFT minting.
Further analysis shows seasonal variations tied to major ecosystem launches and Ethereum mainnet events. High transaction volumes correlate strongly with periods of increased developer activity and new protocol deployments, creating positive feedback loops for adoption.
TradFi Inflows and Institutional Adoption Examples
Institutional players continue exploring L2 environments for tokenized assets and settlement. Examples include major financial firms piloting bridges to established rollups for efficient cross-border operations. Such inflows add stability to TVL figures beyond retail DeFi activity. Banks and asset managers have tested private transaction channels on ZK-based solutions to meet compliance requirements while leveraging public chain transparency.
Additional cases involve real-world asset tokenization projects that prefer Optimistic rollups for their mature oracle integrations. These developments signal growing confidence in the infrastructure's ability to handle large-scale capital movements securely.
Practical Steps to Track L2 Metrics Yourself
- Visit L2Beat for real-time TVL rankings and breakdowns by category, filtering for specific rollup types to compare growth rates over custom time periods.
- Explore Dune Analytics for customizable queries on addresses and volumes, saving dashboards for regular monitoring of key projects.
- Monitor official Ethereum blog updates for protocol changes impacting rollup performance, noting any changes to data availability or gas mechanics.
- Set up alerts on key metrics using on-chain data tools that notify users of significant TVL movements or address spikes.
- Cross-reference multiple sources including Dune and Ethereum.org to validate trends and avoid single-source biases.
- Analyze historical data exports to identify patterns linked to broader market cycles or specific news events.
- Participate in community forums to learn about upcoming features that may influence future metric performance.
These steps empower readers to verify trends independently and make informed observations about ecosystem health.
Recent ETH News Impacts on Rollup Performance
Developments in Ethereum's core protocol, including staking adjustments and blob space optimizations, have directly influenced rollup throughput and cost structures. Projects adapting quickly to these changes have captured disproportionate shares of new activity. News around improved interoperability standards has encouraged developers to build applications that span multiple rollups, boosting overall volumes.
Additional coverage of governance proposals has led to temporary fluctuations in TVL as participants reposition assets ahead of potential upgrades. Staying informed through reliable channels helps contextualize short-term volatility within longer-term adoption narratives.
Common Pitfalls When Interpreting Metrics
One frequent mistake involves focusing solely on headline TVL without examining token distribution or liquidity depth. Another is overlooking the impact of incentive programs that can inflate short-term numbers. Cross-checking with activity metrics such as unique addresses provides a more balanced view of sustainable growth.
Conclusion
The 2026 Ethereum L2 ecosystem reflects maturing competition between Optimistic and ZK approaches. By focusing on TVL, addresses, and institutional signals, observers gain a clearer picture of sustainable growth patterns. Continuous monitoring through established tools remains essential for anyone seeking to understand or participate in this dynamic space.
FAQ: Interpreting L2 Metrics for Investment Decisions
How reliable is TVL as a metric? TVL indicates locked capital but should be paired with activity data to avoid over-reliance on temporary incentives that may not reflect organic demand.
What do active addresses reveal? Sustained growth in unique addresses often signals genuine adoption rather than short-term speculation driven by airdrop farming.
Should investors prioritize ZK or Optimistic rollups? Evaluation depends on use case; ZK offers stronger security guarantees while Optimistic solutions frequently lead in DeFi composability and tooling maturity.
How do transaction volumes affect long-term viability? Consistent high volumes suggest real usage and revenue potential for sequencers and validators supporting the rollup.
What role does TradFi play in future TVL growth? Institutional inflows can provide stability but often come with stricter compliance needs that favor certain technical architectures over others.
No comments yet. Be the first!