 CryptoChain Blog
Introduction to Tokenomics Analysis in 2026
In the fast-evolving world of cryptocurrency, understanding tokenomics is crucial for investors and developers alike. Tokenomics—the economic model behind a cryptocurrency token—determines its long-term viability. By 2026, advanced blockchain analytics tools have made it easier than ever for beginners to dissect these models. This guide focuses on key metrics like supply distribution, burn rates, and holder concentration, using platforms such as Dune Analytics and Nansen.
These tools query onchain data directly from blockchains like Ethereum, Solana, and emerging layer-2 networks, revealing the health of a project's token economy. Whether you're evaluating a new DeFi token or an established altcoin, these insights can predict sustainability and red flags like centralization risks.
Why Tokenomics Matter: Key Metrics Explained
Tokenomics isn't just about total supply; it's about how tokens flow through the ecosystem. Here's what to focus on:
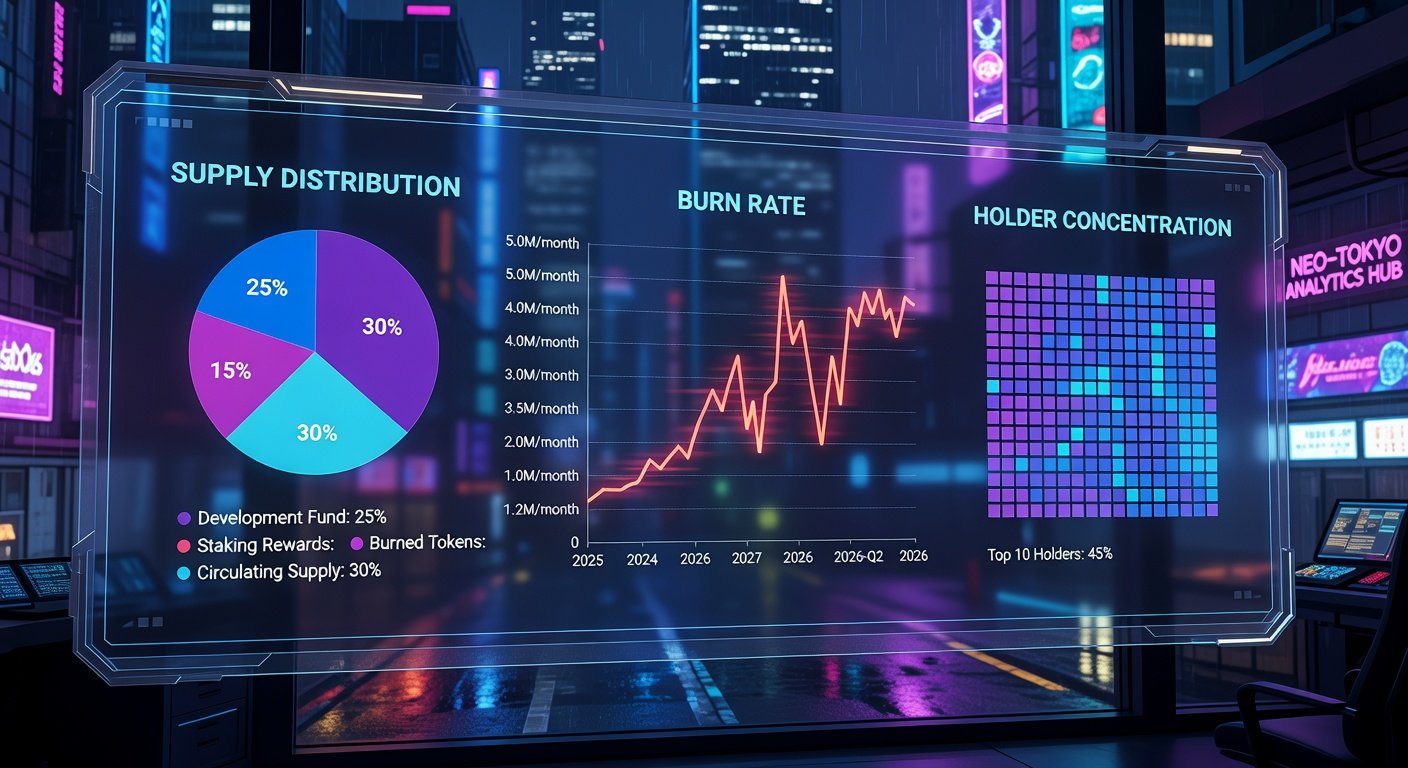
- Supply Distribution: How tokens are spread among holders. Uneven distribution (e.g., 80% held by top 10 wallets) signals centralization risks.
- Burn Rates: Tokens permanently removed from circulation to combat inflation. Consistent burns indicate deflationary pressure and scarcity.
- Holder Concentration: Percentage of supply controlled by whales or insiders. High concentration can lead to price manipulation.
Analyzing these metrics helps spot healthy projects with broad adoption versus rugs or unsustainable pumps.
Top 2026 Blockchain Analytics Tools
By 2026, tools have integrated AI-driven queries and real-time dashboards. Standouts include:
- Dune Analytics: Free SQL-based querying for onchain data across 50+ chains.
- Nansen: Premium wallet labeling and smart money tracking.
- Arkham Intelligence: Visual entity graphs for holder analysis.
We'll dive into step-by-step usage with Dune, the go-to for beginners due to its community dashboards and no-code options.
Step-by-Step: Querying Tokenomics on Dune Analytics
Getting started is straightforward. Follow these steps to analyze a token like a hypothetical 2026 DeFi token "EcoToken" (ERC-20 on Ethereum).
- Sign Up and Explore: Visit Dune and create a free account. Browse the dashboard library—search for "tokenomics" to fork pre-built queries.
- Select Your Token: Note the contract address from Etherscan or CoinGecko. For EcoToken: 0x123...abc.
- Create a Basic Supply Query:
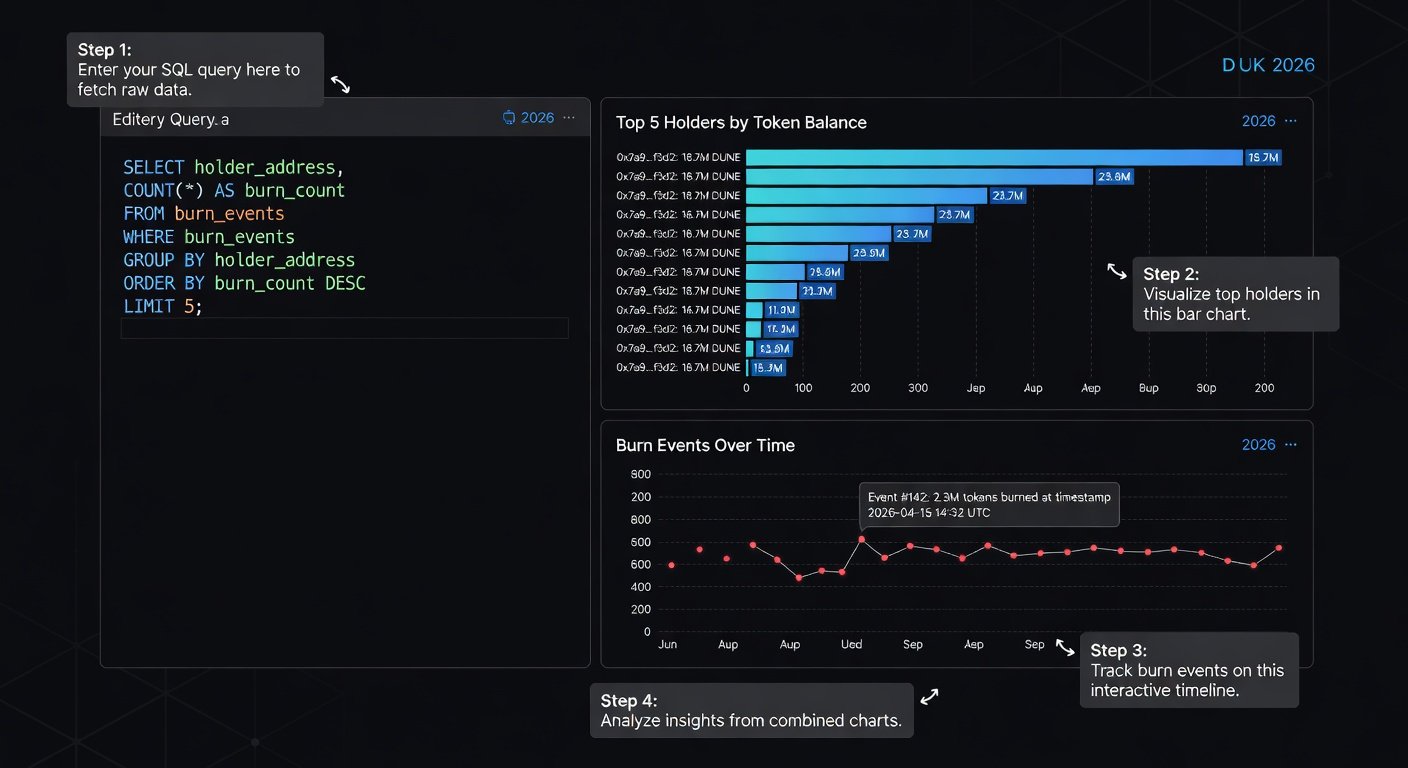
Click "New Query" and use SQL like this:
This tracks total supply over time, spotting mints/burns.SELECT date_trunc('day', block_time) as day, sum(value/1e18) as total_supply FROM ethereum.traces WHERE to = '\xYourTokenContract' AND success = true GROUP BY 1 ORDER BY 1; - Analyze Supply Distribution: Query top holders:
Visualize with Dune's built-in charts. If top 10 hold >50%, caution!SELECT holder, sum(balance/1e18) as amount FROM erc20_ethereum.evt_Transfer WHERE contract_address = '\xYourTokenContract' GROUP BY 1 ORDER BY 2 desc LIMIT 100; - Check Burn Rates: Burns are transfers to dead addresses (e.g., 0x000...dead). Modify the transfer query:
Aggregate daily burns. Healthy projects burn 0.1-1% of supply periodically.WHERE "to" = '\x000000000000000000000000000000000000dead' AND value > 0; - Holder Concentration: Use Dune's holder tables or community dashboards. Aim for Gini coefficient <0.7 (low inequality).
- Visualize and Share: Add line/bar charts, save as dashboard, and export CSV for further analysis.
Pro Tip: Fork popular dashboards like "Token Holder Distribution" for instant insights.
Interpreting Data: Signs of Healthy Tokenomics
Raw data is useless without context. Here's how to read it:
- Green Flags: Broad distribution (thousands of holders), steady burns matching revenue (e.g., 20% of fees), declining whale share over time.
- Red Flags: 90%+ in top wallets, no burns despite high inflation, sudden dumps from insiders.
For prediction: Compare to benchmarks. Sustainable projects like UNI (Uniswap) show balanced metrics post-airdrop.
Advanced Tips with Nansen and Beyond
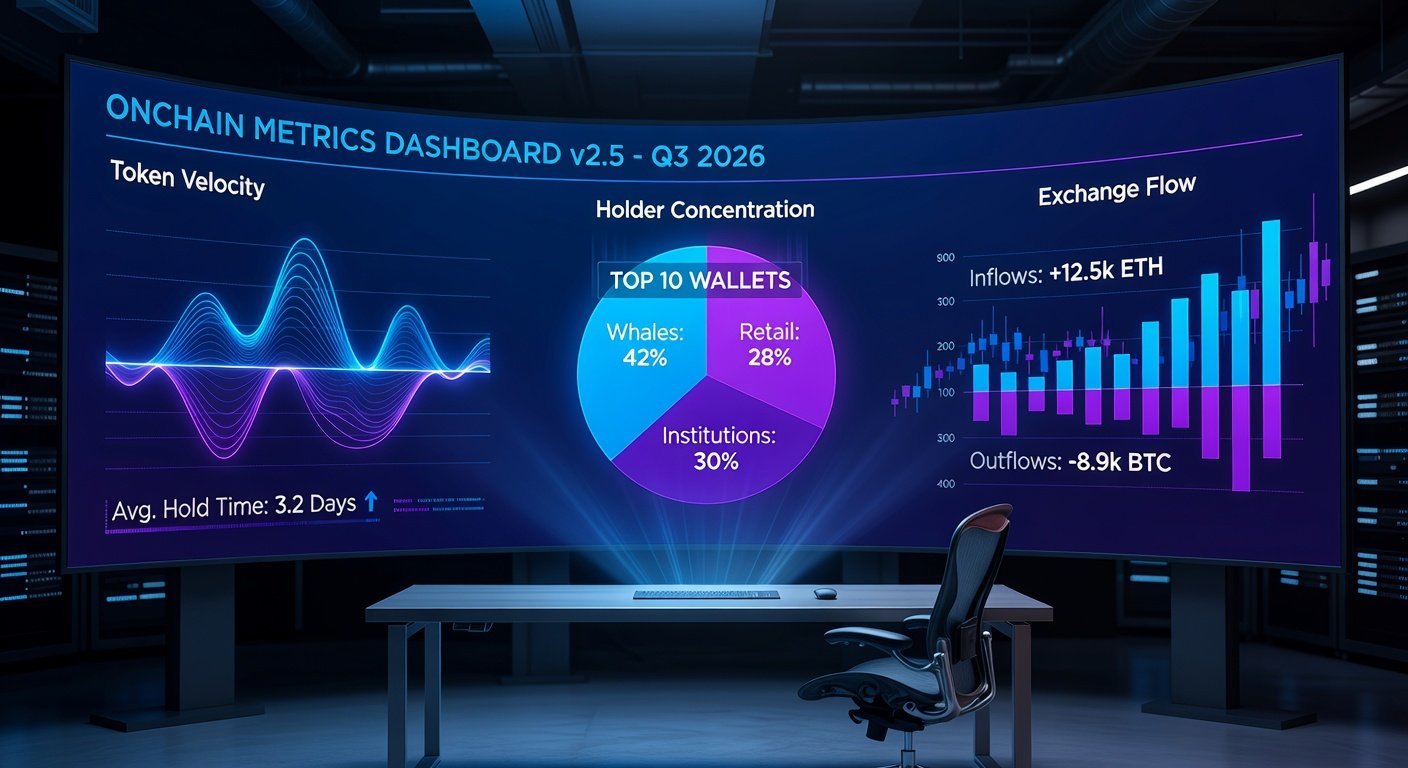
Once comfortable with Dune, upgrade to Nansen for labeled wallets. Track "Smart Money" inflows—whales buying signal upside.
In 2026, integrate Dune API with tools like Zapier for automated alerts on burn events. Cross-reference with DefiLlama for TVL correlation.
Real-World Case Study: Analyzing a 2026 Meme Coin
Take "QuantumDoge"—a Solana meme token. Using Dune's Solana tables:
- Supply: Capped at 1B, 15% burned in year 1.
- Distribution: 40% community, 20% liquidity, top 100 hold 25% (improving).
- Health Score: 8/10—strong burns offset early whale sales.
This analysis predicted 3x growth before mainstream hype.
Common Pitfalls and Best Practices
Avoid: Offchain claims (audit tokenomics onchain only), ignoring chain-specific quirks (e.g., Solana's faster blocks). Best practices: Always verify contract, use multiple tools, track over 30 days.
Conclusion: Empower Your Crypto Decisions
By 2026, blockchain analytics democratize tokenomics research. Start with Dune today, master these metrics, and spot winners early. Healthy tokenomics = sustainable projects. Dive in and level up your portfolio.
No comments yet. Be the first!