 CryptoChain Blog
Why Onchain Metrics Matter for Tokenomics in 2026
In the evolving world of blockchain and crypto, tokenomics—the economic model behind a token—determines long-term success. But hype and whitepapers only go so far. Enter onchain metrics: raw blockchain data that exposes the true health of a token's economy. By 2026, platforms like Dune Analytics and advanced tools have made these insights accessible to all investors.
This article dives into seven critical onchain metrics: holder concentration, token velocity, exchange inflows, active addresses, transaction volume, supply on exchanges, and MVRV ratio. We'll use real-world 2026 examples from tokens like emerging L2 solutions and DeFi protocols to show how they predict sustainability and growth. Plus, practical tips to apply them in your analysis.
The Seven Critical Onchain Metrics
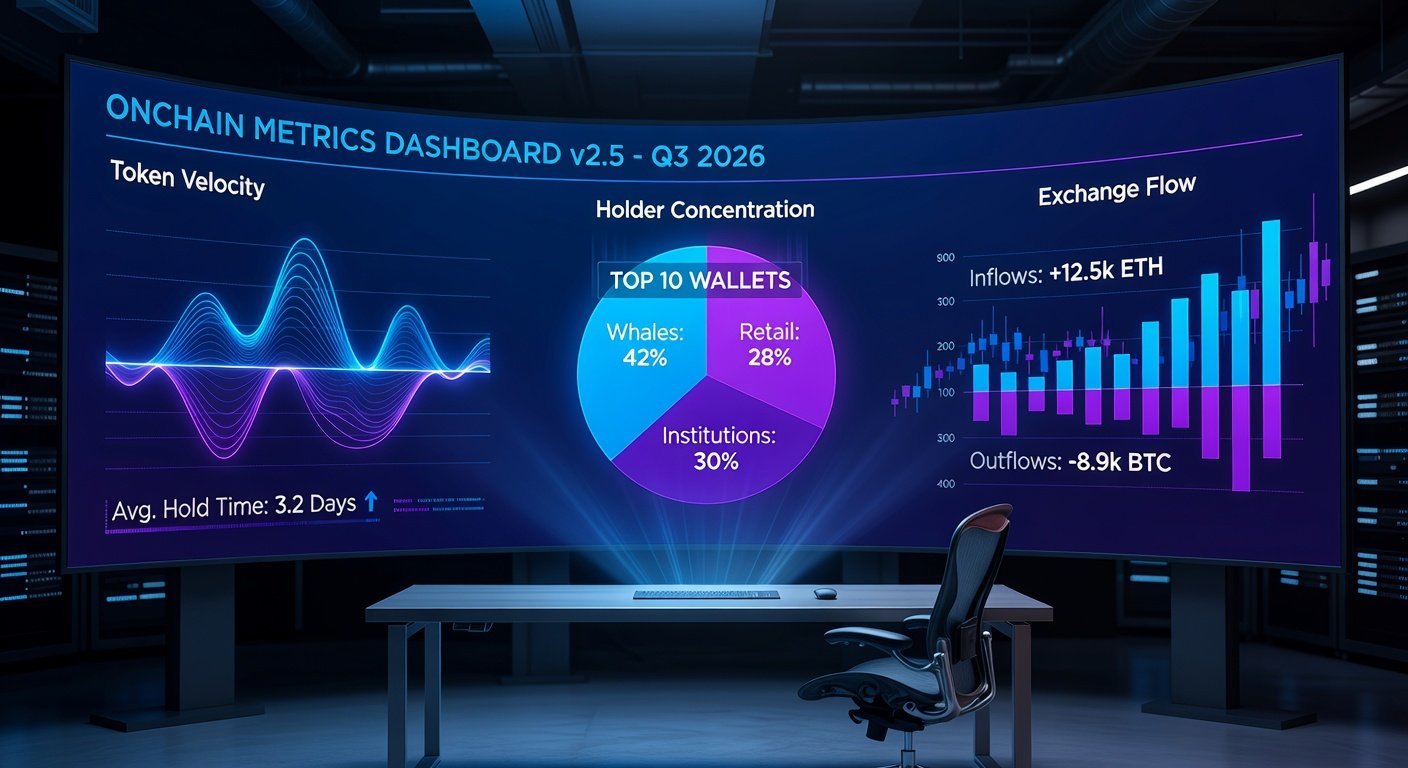
1. Holder Concentration
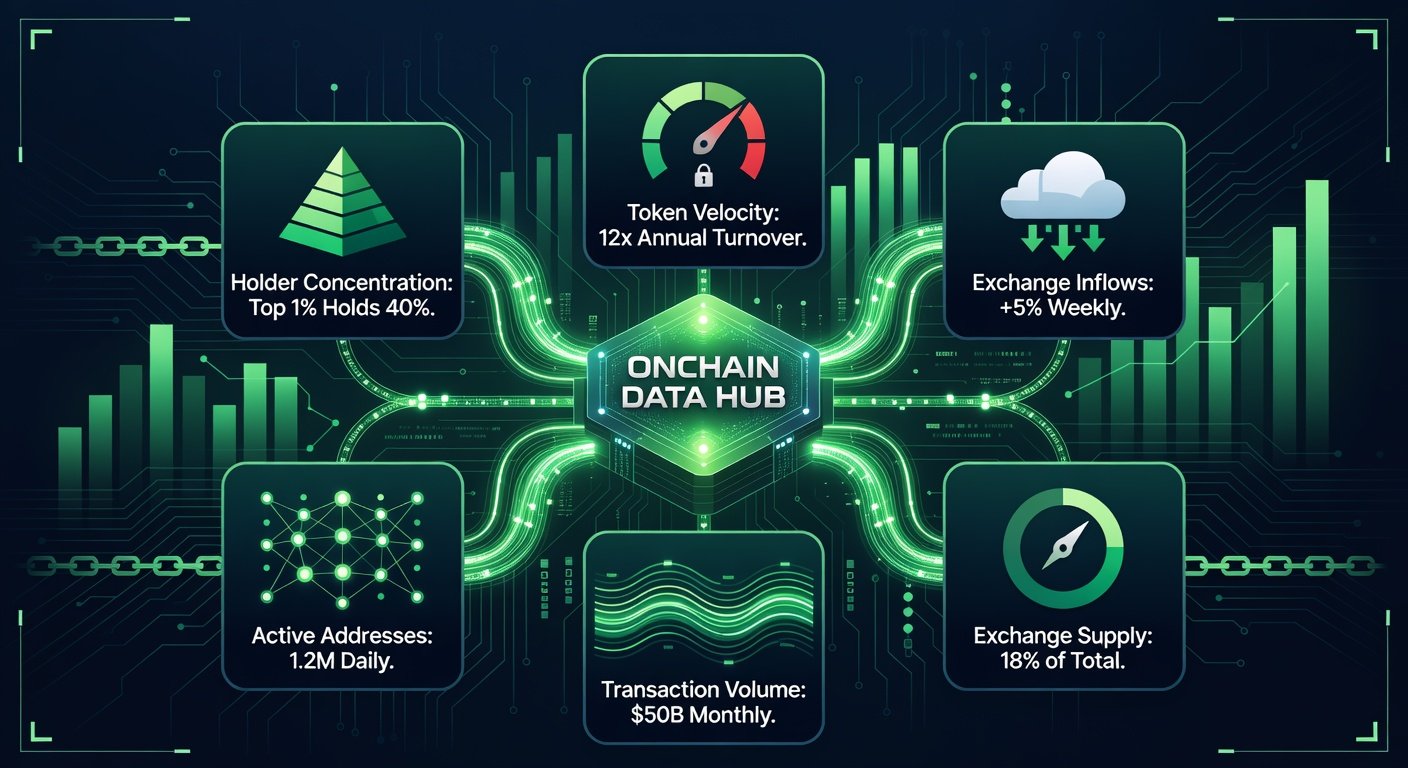
Holder concentration measures how much of the token supply is held by the top wallets (e.g., top 10 or 100 holders). High concentration signals centralization risks, like whale dumps crashing prices. Healthy tokenomics shows diversified ownership, ideally with top 100 holding under 30-40%.
In Q1 2026, Solana's SOL token saw top 100 holders drop from 45% to 32% amid retail adoption surges, per Glassnode data. This diversification predicted a 150% rally as it reduced dump risks. Conversely, a hyped memecoin like DOGZ had 65% whale-held supply, leading to a 70% crash post-hype.
2. Token Velocity
Token velocity is the rate tokens change hands: Velocity = Transaction Volume / Average Circulating Supply. High velocity in speculative tokens erodes value (used and dumped fast), while low velocity indicates HODLing and store-of-value potential.
For Ethereum's ETH in mid-2026, velocity fell to 0.15 amid staking booms, signaling strong holder conviction and a path to $10K. Meanwhile, a failing yield farm token hit velocity 5.2, hyperinflation via constant churning, wiping 90% value.
3. Exchange Inflows and Outflows
Exchange inflows track tokens moving to exchanges (sell pressure), outflows to wallets (HODL signal). Net outflows > inflows predict price pumps.
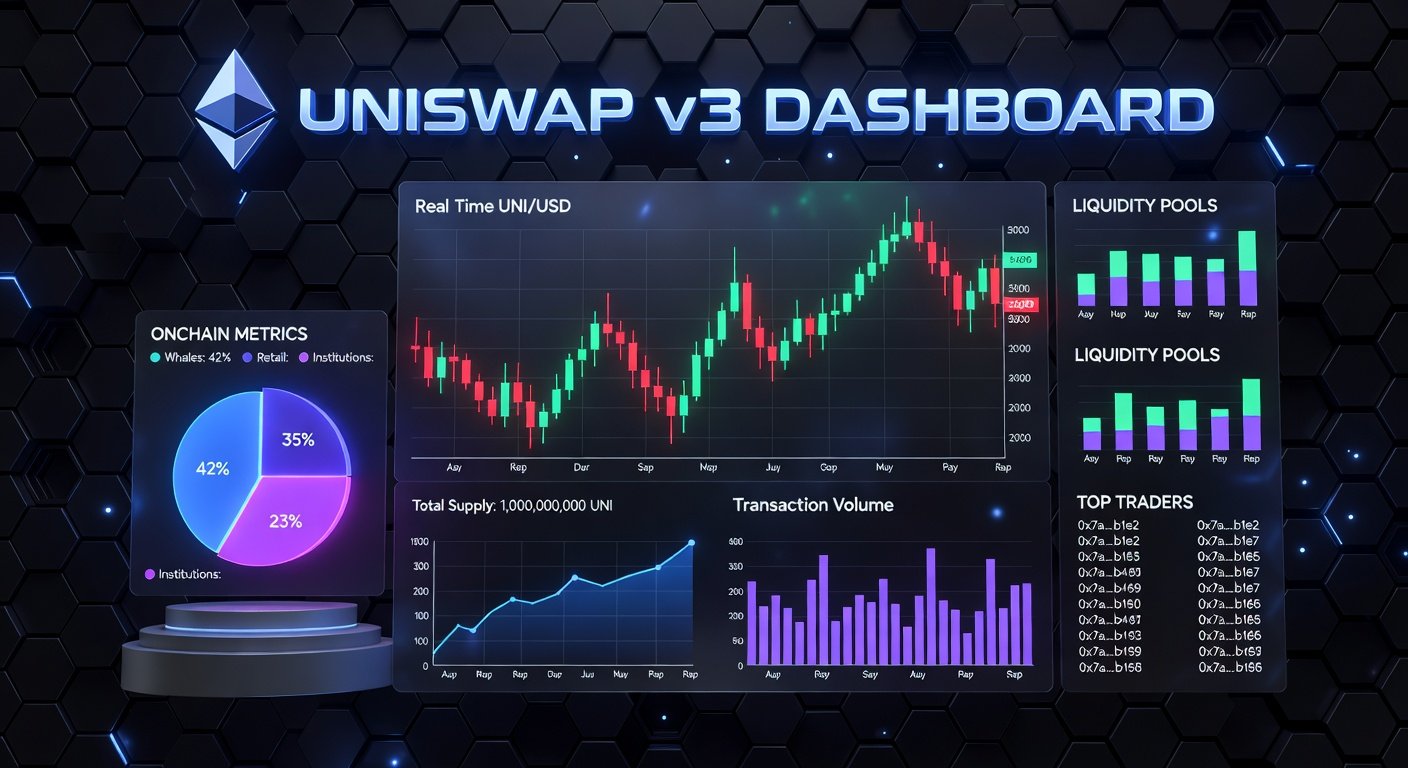
2026 data from CoinGecko showed Bitcoin's BTC with 500K BTC net outflows during ETF approvals, fueling a bull run. A DeFi token like UNI reversed from inflows of 20% supply to outflows, correlating with 300% gains.
4. Active Addresses
Active addresses count unique wallets interacting daily/weekly. Steady growth signals real usage; stagnation or drops reveal fading interest.
By 2026, Arbitrum's ARB hit 1.2M daily actives, up 400% YoY, validating L2 scaling and driving 200% token appreciation. A ghost chain's altcoin dwindled to 5K actives, presaging delisting.
5. Transaction Volume
Onchain transaction volume (in USD or native units) reflects network utility. Organic growth beats volume spikes from wash trading.
PancakeSwap's CAKE in 2026 averaged $2B daily volume organically, supporting 180% YTD growth. Inflated volumes on a DEX clone (90% wash trades) collapsed when bots fled.
6. Supply on Exchanges
This metric tracks tokens held on exchange wallets. Declining supply reduces liquid sell pressure; spikes warn of dumps.
2026 Chainlink (LINK) exchange supply hit historic lows at 12%, enabling a breakout rally. A rug-pull prone token spiked to 45%, followed by 85% plunge.
7. MVRV Ratio
Market Value to Realized Value (MVRV) compares market cap to onchain realized cap (tokens valued at last move price). MVRV <1 = undervalued buy; >3 = overvalued sell.
Cardano's ADA in late 2026 traded at MVRV 0.85, attracting institutions for 250% upside. Overheated NFTs tokens at MVRV 4.2 corrected 60%.
These metrics interconnect: e.g., low velocity + outflows + rising actives = bullish convergence.
Practical Tips for Investors Applying These Metrics
- Choose Reliable Tools: Use free dashboards on Dune or paid insights from Glassnode. Set alerts for thresholds like exchange supply >20%.
- Combine Metrics: Don't isolate—look for 4+ green signals (e.g., low concentration + outflows + low MVRV).
- Contextualize Trends: Compare YoY or vs. BTC. 2026 example: SOL's metrics mirrored ETH 2021 bull, signaling alpha.
- Monitor Weekly: Daily noise misleads; weekly aggregates spot sustainability.
- Backtest Portfolios: Replay 2026 data—tokens with diversified holders + low velocity outperformed by 3x.
- Avoid Hype Traps: High inflows + concentration = exit signal, even if TVL pumps.
- Automate with APIs: Integrate CoinMetrics data into spreadsheets for custom scores.
Conclusion: Master Onchain for 2026 Wins
Onchain metrics cut through crypto noise, revealing tokenomics truth. In 2026's mature market, investors wielding holder concentration, velocity, and peers will spot multibaggers early while dodging rugs. Start tracking today—your portfolio depends on it.

No comments yet. Be the first!