 CryptoChain Blog
Introduction to Onchain Token Unlock Monitoring in 2026
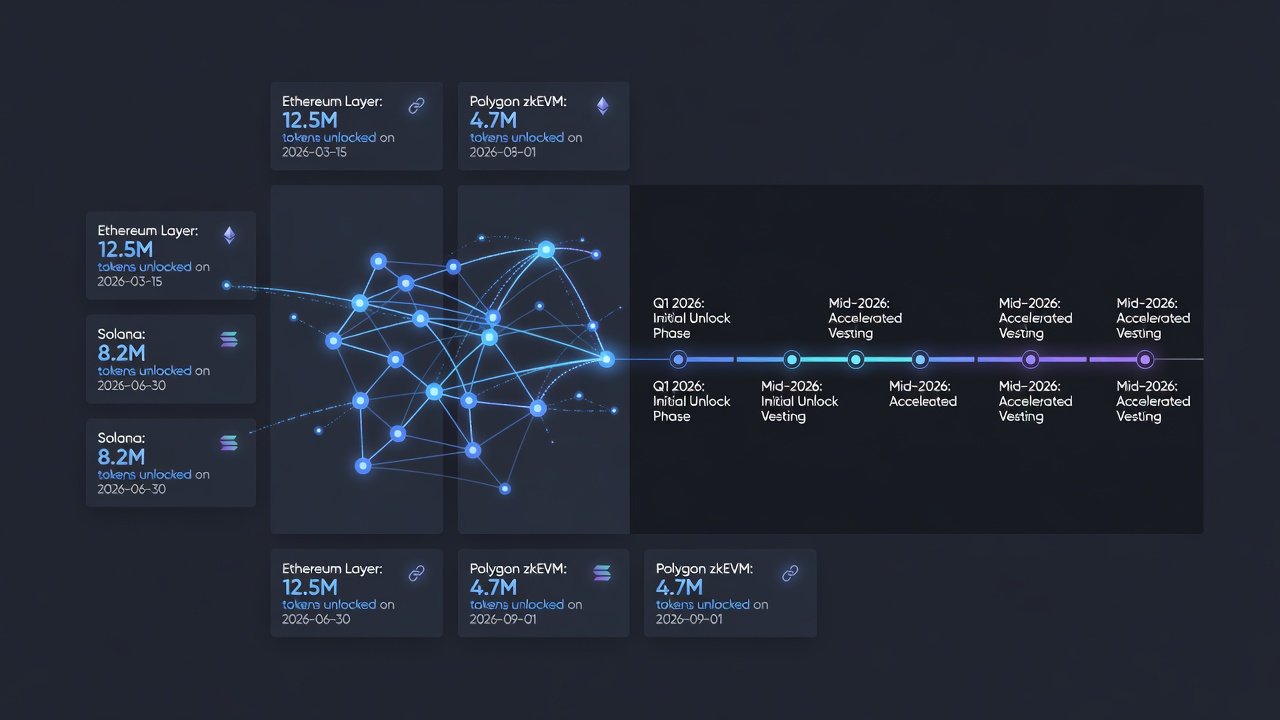
Token unlock schedules represent critical events in cryptocurrency ecosystems, often triggering significant price volatility and liquidity shifts. In 2026, analysts rely on advanced onchain monitoring techniques to move beyond basic supply metrics and gain actionable insights. This guide provides DeFi researchers with practical workflows for parsing vesting contracts, tracking cliff and linear releases, and correlating unlocks with market movements. Understanding these dynamics allows professionals to anticipate potential sell pressure and identify opportunities in DeFi protocols where token distribution plays a pivotal role in governance and liquidity provision.
Effective monitoring starts with understanding vesting mechanics embedded in smart contracts. Projects typically implement time-based releases through transparent onchain logic, allowing anyone to query blockchain data directly. As the crypto market matures in 2026, the volume of tokens subject to vesting continues to grow, making sophisticated tracking essential for both institutional and retail analysts.
Parsing Vesting Contracts Across Major Chains
Begin by identifying the vesting contract address for a given token. On Ethereum and EVM-compatible chains, use explorers to inspect contract code and events. Focus on functions like release() or claim() that emit Transfer events tied to unlock timestamps. Analysts frequently decode ABI interfaces to extract parameters such as startTime, duration, and cliff periods stored in contract storage slots.
For Solana-based protocols, leverage program accounts and transaction logs. Analysts often combine data from multiple chains using unified indexing tools. A typical workflow involves filtering transactions where token amounts exceed predefined thresholds during scheduled unlock windows. This process requires familiarity with chain-specific query languages and careful validation against official project documentation to avoid misinterpreting proxy contracts or upgradeable logic.
Monitoring Cliff and Linear Releases
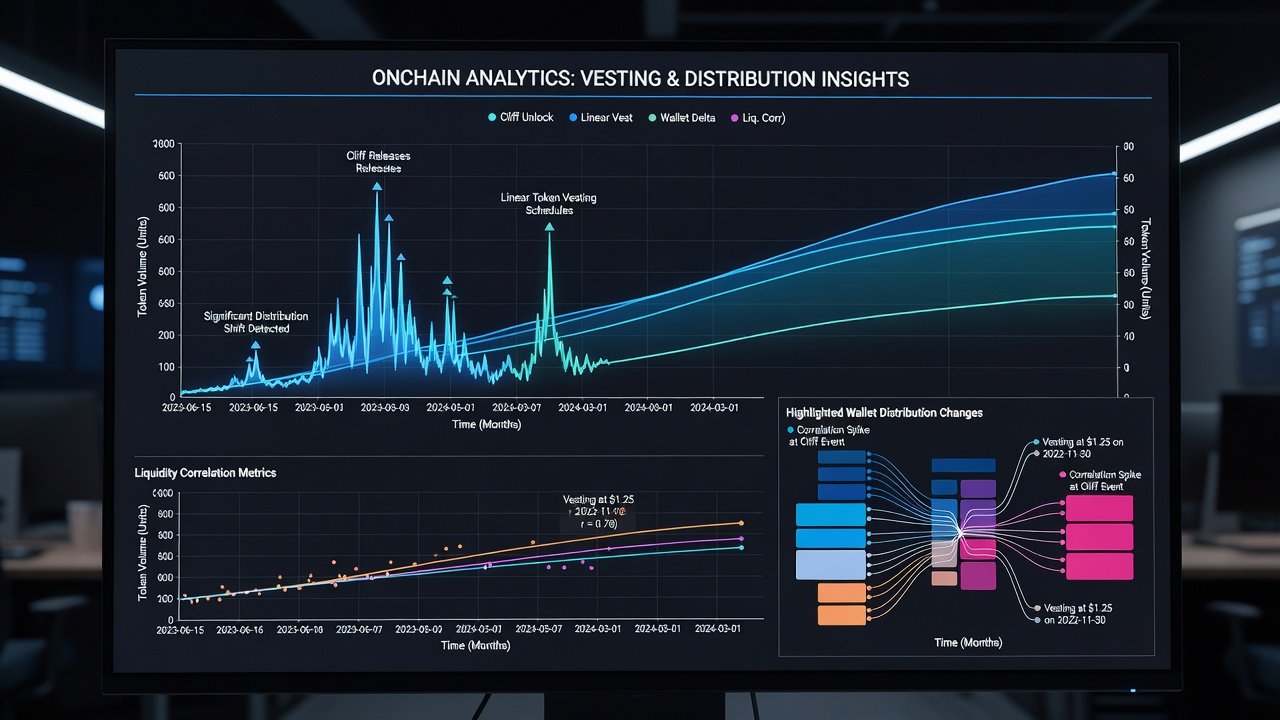
Cliff releases occur at specific dates when large portions of tokens become available, while linear releases distribute tokens gradually over time. To monitor these, query historical and upcoming unlock events by decoding contract storage variables that store start times, durations, and cliff periods. Tools that index blockchain events can surface these schedules automatically when configured with the correct contract addresses.
Cross-reference these dates with onchain holder distributions. Sudden increases in circulating supply can be flagged by comparing pre- and post-unlock balances in treasury or team wallets. In practice, analysts build scripts that poll for new Transfer events from vesting contracts and compare them against expected release curves derived from the original tokenomics parameters published at launch.
Building Custom Alerts for Large Unlocks
Custom alerts help analysts react in real time. Set thresholds for unlock sizes relative to daily trading volume. Integrate onchain data platforms to trigger notifications when a vesting contract initiates a release exceeding 5% of total supply. These alerts can be enhanced by incorporating price feeds and liquidity metrics to prioritize high-impact events.
- Define alert parameters based on tokenomics data and historical volatility patterns
- Use webhook integrations for instant Slack or Discord notifications
- Combine unlock alerts with liquidity pool depth changes and order book imbalances
- Test alert accuracy against past unlock events to reduce false positives
Analyzing Holder Distribution Changes Post-Unlock
After an unlock, examine shifts in token concentration. Tools that track wallet clusters reveal whether unlocks flow to exchanges, liquidity pools, or long-term holders. Compare top holder percentages before and after release dates to identify potential sell pressure. Clustering techniques help distinguish between organic distribution and coordinated movements by early investors or team members.
Red-flag checklists include monitoring for rapid transfers to centralized exchange deposit addresses or sudden spikes in sell orders on decentralized exchanges. Analysts often layer additional onchain signals such as increased approval transactions to DEX routers, which may indicate imminent selling activity following a large unlock.
Case Studies from Major Protocols
Reviewing historical unlocks from established projects provides valuable patterns. For example, protocols with transparent linear vesting often show milder price impacts compared to those with large cliff releases. Analysts can replicate these studies using public dashboards that aggregate unlock events across DeFi tokens. Case studies from projects like those in the Ethereum ecosystem demonstrate how governance-controlled vesting adjustments can alter expected timelines and require dynamic monitoring setups.
Step-by-Step Queries and Dashboard Templates
Start with basic SQL queries on indexed blockchain data to list upcoming unlocks. Example structure: select contract addresses, unlock amounts, and timestamps where release conditions are met. Build dashboards that visualize unlock calendars alongside price and volume charts. Advanced templates incorporate multi-chain aggregation, automated correlation calculations between unlock events and liquidity metrics, and exportable CSV reports for further statistical analysis.
Practical templates often include multi-chain views and automated correlation metrics between unlocks and liquidity metrics. Researchers can extend these by adding custom Python scripts that pull data via public RPC endpoints and generate daily summary reports.
Tools and Platforms for Onchain Monitoring
Several established platforms support comprehensive token unlock tracking. Analysts frequently combine data from blockchain explorers with specialized analytics suites. For instance, querying event logs on Etherscan provides raw transaction details that can be cross-verified with indexed datasets. Similarly, Dune Analytics offers community-built dashboards focused on vesting schedules across multiple chains.
Correlating Unlocks with Liquidity Shifts
Unlock events rarely occur in isolation. Successful monitoring correlates release schedules with changes in liquidity pools, order book depth, and funding rates on derivatives platforms. Analysts track metrics such as TVL fluctuations in relevant pools immediately after scheduled unlocks to quantify market absorption capacity. This correlation analysis helps distinguish between routine distributions and potentially manipulative large-scale movements.
Advanced Techniques for Multi-Chain Tracking
Many protocols now deploy tokens across several blockchains simultaneously. Advanced workflows involve synchronizing unlock data from Ethereum, Solana, and layer-2 networks using standardized indexing frameworks. Analysts maintain unified calendars that account for differing block times and finality guarantees, ensuring no scheduled release is overlooked due to chain-specific delays.
Common Pitfalls and How to Avoid Them
Common mistakes include relying on single data sources without verification and failing to account for governance votes that modify vesting terms. Always cross-check contract code against audited versions and maintain version control on monitoring scripts. Another frequent issue is overlooking vesting cliffs that are conditional on milestones rather than pure time-based triggers.
Conclusion
Mastering onchain monitoring of token unlock schedules equips DeFi researchers with a competitive edge in 2026. By combining contract parsing, real-time alerts, and distribution analysis, analysts can anticipate market reactions and refine investment strategies effectively. Explore resources from DefiLlama and Solana to implement these workflows today and stay ahead of evolving token distribution dynamics.
No comments yet. Be the first!