 CryptoChain Blog
Introduction to Staking Yield Tokenomics in 2026
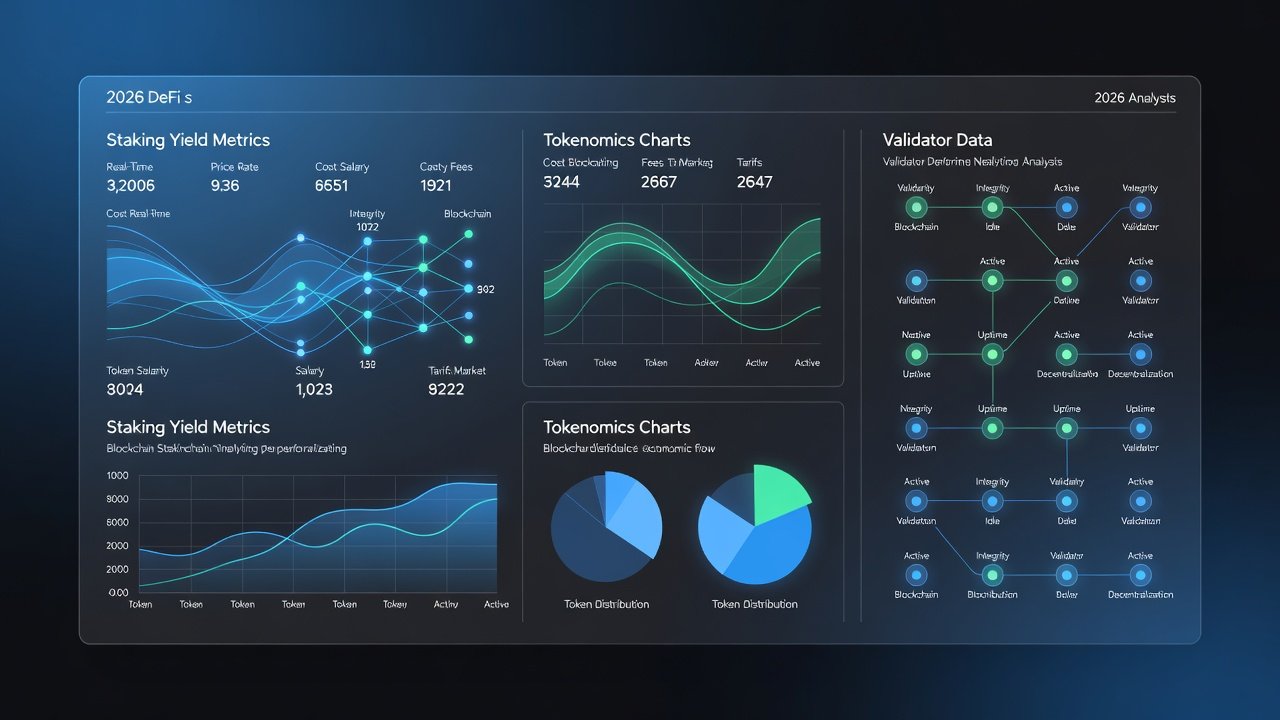
As decentralized finance continues to evolve rapidly, evaluating staking yield sustainability has become a critical skill for token holders, analysts, and protocol developers alike. In 2026, onchain analytics tools offer unprecedented visibility into the underlying mechanics of tokenomics models. This guide provides practical, data-driven methods to distinguish genuine economic value generated from protocol activity versus yields supported primarily by inflationary token emissions. By examining validator reward flows, delegation patterns, and revenue sources directly from blockchain data, participants can make more informed decisions about where to allocate capital in staking opportunities.
The shift toward sustainable tokenomics reflects broader market maturation. Early DeFi protocols often relied on aggressive emissions to attract liquidity, but many of those models proved fragile when incentives dried up. Today, sophisticated analysts focus on metrics that reveal whether staking rewards are backed by real usage fees or simply new token creation. This distinction matters because inflationary rewards can erode holder value over time through supply dilution, even if advertised APYs appear attractive on the surface.
Core Metrics for Assessing Yield Sustainability
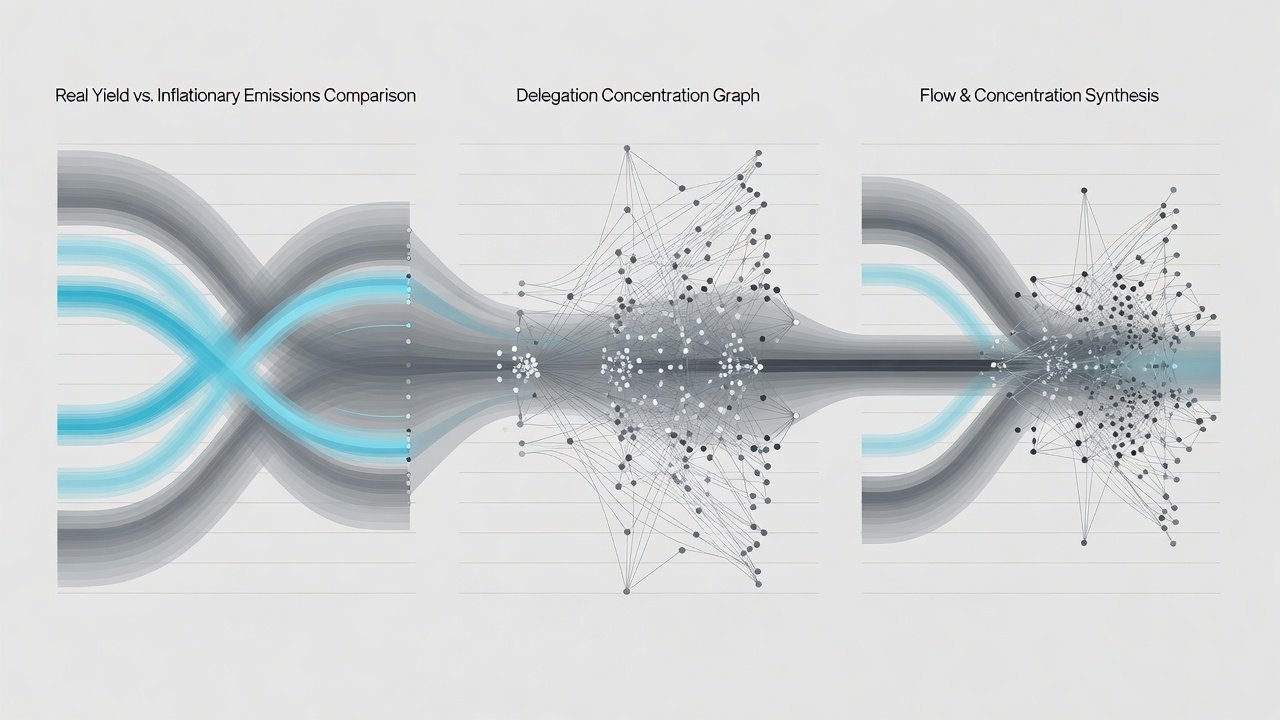
Three primary onchain metrics form the foundation of any rigorous analysis: real yield versus inflationary emissions, validator reward flows, and delegation concentration. Real yield represents rewards funded directly by protocol-generated revenue such as trading fees, lending interest, or liquidation proceeds. In contrast, inflationary emissions increase the total token supply, distributing new units to stakers without corresponding economic activity. Tracking the ratio between these two sources helps identify protocols where yields may decline as emissions taper.
Validator reward flows provide insight into incentive alignment. Onchain transaction logs show how rewards split between validators who secure the network and delegators who contribute stake. Protocols with unbalanced flows may face governance capture or reduced participation from smaller stakeholders. Delegation concentration, measured through stake distribution across validator addresses, highlights centralization risks. When a small number of entities control a majority of staked tokens, the network becomes vulnerable to coordinated attacks or policy changes that disadvantage retail participants.
Step-by-Step Workflow for Tracking Yield Sources Across Protocols
Implementing a repeatable workflow allows analysts to compare protocols consistently. Begin by identifying the relevant smart contracts responsible for reward distribution, typically found in protocol documentation or verified on block explorers. Query historical events for reward minting and fee collection transactions over a defined period, such as the past 90 days. Next, calculate the percentage of total rewards attributable to fee revenue by dividing fee-derived distributions by the sum of all rewards issued.
Monitor circulating supply changes using token contract data to quantify net inflation. Cross-reference this with delegation data pulled from staking module events to map concentration trends. For multi-chain analysis, repeat the process on each network while normalizing for differences in block times and reward epochs. Document findings in a spreadsheet or database to track changes over successive periods. This methodical approach surfaces protocols where apparent yields mask underlying dilution or concentrated control.
Comparing L1 and L2 Staking Dynamics
Layer 1 protocols typically feature native token staking tied directly to consensus security. Rewards often incorporate both inflationary components to bootstrap validator sets and variable fees from transaction activity. Because L1s must maintain high security budgets, many continue modest emissions even after reaching maturity, creating ongoing dilution pressure.
Layer 2 solutions present distinct dynamics. Rollups and sidechains frequently implement staking around shared security models or sequencer incentives. Yields on L2s tend to derive more heavily from actual usage fees collected within the scaling environment, resulting in lower but more sustainable returns. Data from leading analytics platforms shows L2 staking exhibits reduced volatility in reward composition compared with many L1s. Analysts should evaluate whether an L2's staking mechanism inherits security from its parent chain or operates independently, as this affects long-term yield predictability and risk exposure.
Case Studies from Top DeFi Platforms
Practical application becomes clearer through examination of established platforms. Data aggregated on DeFiLlama illustrates protocols where staking rewards closely track generated fees rather than relying on emissions. For Ethereum staking specifically, dashboards on Dune Analytics enable detailed tracking of validator performance, effective yield after dilution, and reward source breakdown. Layer 2 insights available via L2Beat demonstrate how staking integrates with optimistic and zk-rollup architectures, often revealing more fee-driven reward structures. Additional examples include Cosmos ecosystem chains where onchain governance proposals have adjusted emission schedules based on real yield thresholds, providing templates for community-driven sustainability improvements.
Identifying Red Flags in Unsustainable APY Models
Certain patterns consistently indicate elevated risk of yield collapse. APYs that significantly exceed verifiable protocol revenue signal heavy dependence on emissions that may not persist. Validator sets dominated by fewer than ten entities warrant scrutiny for potential collusion or reduced censorship resistance. Opaque reward mechanisms that obscure the origin of distributed tokens prevent accurate sustainability assessment. Rapid increases in total supply without matching demand growth from new users or use cases typically precede yield compression. Monitoring these indicators through onchain queries allows early detection before market prices fully reflect deteriorating fundamentals.
Building Custom Dashboards for Ongoing Monitoring
Creating tailored dashboards transforms raw blockchain data into actionable intelligence. Select a visualization platform that supports direct queries against indexed chain data. Define core panels for real-yield ratios, inflation rates, validator reward splits, and stake distribution heatmaps. Automate data refreshes on daily or weekly intervals to capture evolving conditions. Incorporate alerts triggered when key thresholds are breached, such as delegation concentration exceeding 60 percent among the top five validators. Combining multiple data sources yields a comprehensive view that single-metric snapshots cannot provide. Regular review of dashboard outputs helps token holders adjust positions proactively rather than reacting after yield changes become obvious.
Advanced users may extend dashboards with custom scripts that pull data from multiple chains simultaneously, enabling portfolio-level comparisons. This level of monitoring proves especially valuable during periods of protocol upgrades or governance votes that alter reward parameters.
Conclusion
Mastering onchain analytics for staking yield tokenomics equips DeFi participants with the insights needed to navigate 2026's complex landscape. By prioritizing sustainable metrics, applying structured workflows, and maintaining vigilant dashboards, analysts and holders can identify resilient opportunities while avoiding those built on fragile foundations. The techniques outlined here support ongoing evaluation as protocols continue to refine their economic models in response to market demands and competitive pressures.
No comments yet. Be the first!