 CryptoChain Blog

Introduction to Bitcoin L2 Tokenomics in 2026
Bitcoin Layer 2 solutions have matured significantly by 2026, extending the base layer's security while introducing complex token economies. Onchain analytics now provide granular visibility into these systems, revealing how supply dynamics, fee distributions, and incentive programs interact. This deep dive equips advanced users with frameworks to analyze emerging L2 networks beyond surface-level token distributions. Practitioners seek practical methods to interpret data from tools that query blockchain states directly, enabling better-informed decisions on participation and risk management. The growth of these networks has created demand for detailed examination of economic models that differ from earlier scaling attempts.
Supply Mechanisms in Emerging Bitcoin L2 Networks
Supply mechanics in Bitcoin L2s often combine fixed caps with dynamic emission schedules tied to network activity. Many protocols implement halving events synchronized with Bitcoin's, while others introduce vesting cliffs for team and ecosystem allocations. Onchain data reveals circulating supply through transparent smart contract states, allowing analysts to track unlock schedules precisely. For instance, certain L2s release tokens gradually based on transaction throughput, creating predictable yet activity-dependent inflation curves. Analysts monitor contract variables that control emission rates, noting how changes in base layer fees indirectly influence L2 token release timing. This approach contrasts with purely inflationary models seen in earlier altcoin projects and provides a more sustainable foundation when paired with fee revenue sharing.
Fee Distribution Models Unique to Bitcoin Scaling
Fee models in 2026 L2s typically allocate portions to stakers, liquidity providers, and protocol treasuries. Unlike Ethereum-centric designs, Bitcoin L2 fees frequently route through bridge contracts that settle on the base layer. Analytics platforms expose these flows, highlighting how gas rebates and priority fees create sustainable revenue cycles. In practice, a portion of collected fees may return to users who lock assets in specific pools, while the remainder supports ongoing development. Onchain queries can isolate fee recipient addresses and calculate effective yields over time. This structure encourages long-term holding by aligning incentives with actual network usage rather than speculative trading alone.
Liquidity Incentives and Their Onchain Footprint
Liquidity programs reward participants with native tokens for providing depth on decentralized exchanges and bridges. Tracking these incentives requires monitoring pool contract addresses and reward claim transactions. Successful models balance short-term boosts with long-term retention through decaying emission rates. Onchain dashboards allow filtering of claim events by address cohorts, revealing whether rewards concentrate among a few large providers or distribute broadly. Analysts often examine the ratio of rewards claimed versus tokens locked to assess program efficiency. Adjustments to incentive parameters appear in governance proposals that can be reviewed through onchain voting records.
Key Metrics: Transaction Velocity and Holder Concentration
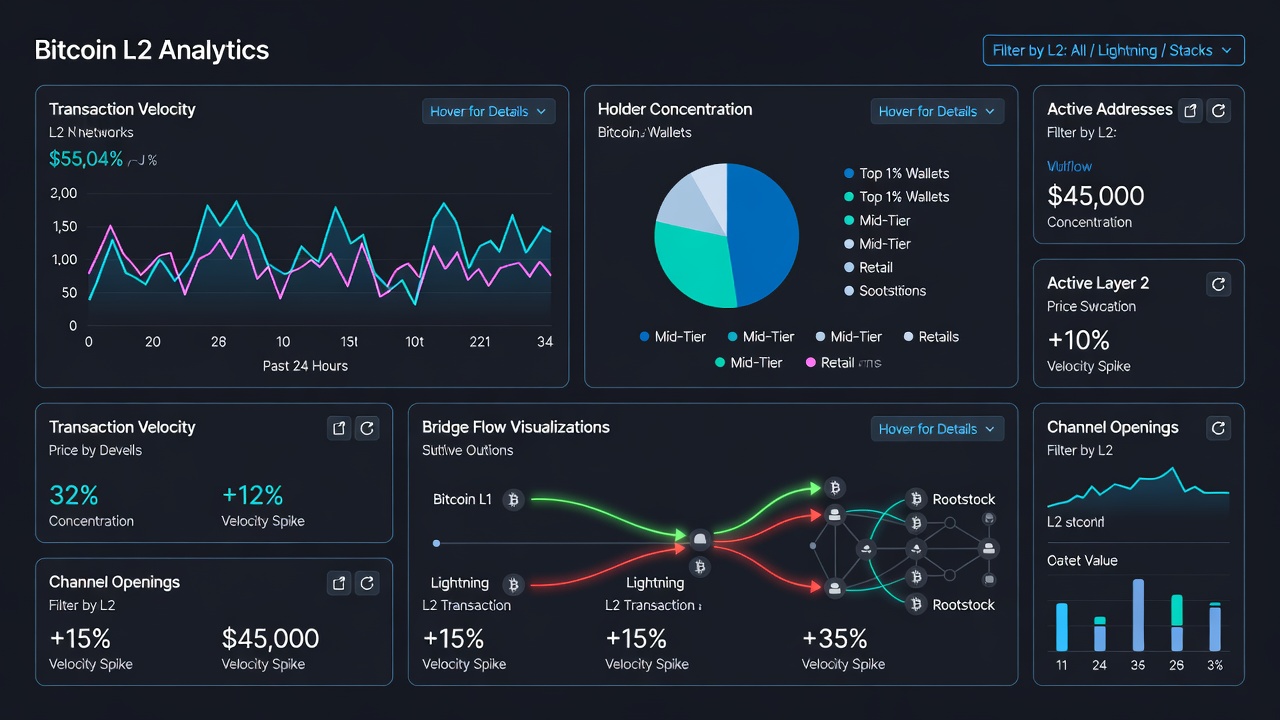
Transaction velocity measures how frequently tokens circulate, calculated as onchain transfer volume divided by average circulating supply. Holder concentration is assessed via Gini coefficients derived from address balance distributions. Bridge flow analysis examines inflows and outflows across peg contracts, signaling capital migration between layers. High velocity combined with low concentration often indicates healthy usage, whereas the opposite pattern may suggest accumulation by entities preparing for large unlocks. These metrics become especially valuable when tracked over rolling periods to identify trends ahead of major network upgrades.
Step-by-Step Example: Tracking Token Unlocks
- Identify the vesting contract address via official documentation or explorer queries.
- Use onchain tools to query unlock timestamps and recipient addresses.
- Monitor transaction logs for large transfers coinciding with unlock dates.
- Compare pre- and post-unlock velocity to gauge selling pressure.
- Cross-reference with bridge activity to detect liquidity shifts.
- Review associated governance votes that might alter future unlock schedules.
- Calculate the percentage of total supply affected and simulate impact scenarios using historical velocity data.
Comparing Incentive Structures Across Top L2s
- Network A emphasizes staking rewards with 40% of fees directed to validators, resulting in lower velocity but stronger holder retention.
- Network B focuses on liquidity mining with time-locked bonuses that decay over six-month cycles, encouraging repeated participation.
- Network C integrates hybrid models combining fee shares and ecosystem grants, creating diversified income streams for different user types.
- Network D ties emissions directly to bridge volume, making incentives responsive to actual cross-layer activity.
These differences influence risk profiles, with staking-heavy models showing lower velocity but higher concentration. Comparing them side by side helps practitioners select networks aligned with their risk tolerance and time horizons.
Using Blockchain Data Tools for In-Depth Analysis
Advanced practitioners rely on multiple data providers to cross-verify findings. Queries can be constructed to pull historical fee distributions, token transfer graphs, and liquidity pool compositions. Visualization layers on top of raw data help spot anomalies such as sudden concentration spikes. Regular monitoring of these tools supports proactive portfolio adjustments before market-moving events occur.
Practical Frameworks for Portfolio Risk Assessment
Integrate onchain signals into risk models by weighting velocity against concentration metrics. High bridge outflows may indicate deleveraging risks. Always validate findings across multiple data providers and consider base-layer settlement finality when evaluating L2 token exposure. A sample framework involves scoring networks on three axes: transparency of unlocks, sustainability of fee distribution, and resilience of liquidity incentives. Portfolios can then be rebalanced quarterly based on score changes. This method reduces reliance on external narratives and grounds decisions in verifiable blockchain activity.
Common Mistakes to Avoid When Analyzing L2 Tokenomics
One frequent error is overlooking bridge contract complexities that affect apparent token supply. Another involves ignoring the lag between onchain unlocks and actual market impact due to vesting cliffs. Analysts should also avoid single-source data dependency, as different explorers may present slightly varying views of the same transactions. Finally, failing to account for governance changes can lead to outdated models of incentive structures.
FAQs
How do onchain tools help track Bitcoin L2 unlocks?
They query contract states and transaction histories to surface scheduled releases before they impact markets, allowing preemptive position adjustments.
What metrics matter most for liquidity incentives?
Pool TVL trends, claim frequency, and retention rates after reward periods end provide the clearest signals of program health.
Can bridge flows predict token price movements?
Persistent outflows often correlate with reduced on-layer demand, though correlation is not causation and should be combined with velocity analysis.
How frequently should practitioners review these metrics?
Weekly scans of velocity and concentration combined with monthly deep dives into unlock schedules offer a balanced monitoring cadence.
Conclusion
Mastering Bitcoin L2 tokenomics in 2026 requires combining supply transparency with real-time fee and incentive analytics. Practitioners who apply these frameworks gain clearer visibility into sustainable network economics. Bitcoin.org and Chainalysis offer foundational resources for further exploration.

No comments yet. Be the first!