 CryptoChain Blog
Introduction to Onchain Tokenomics Audits in 2026
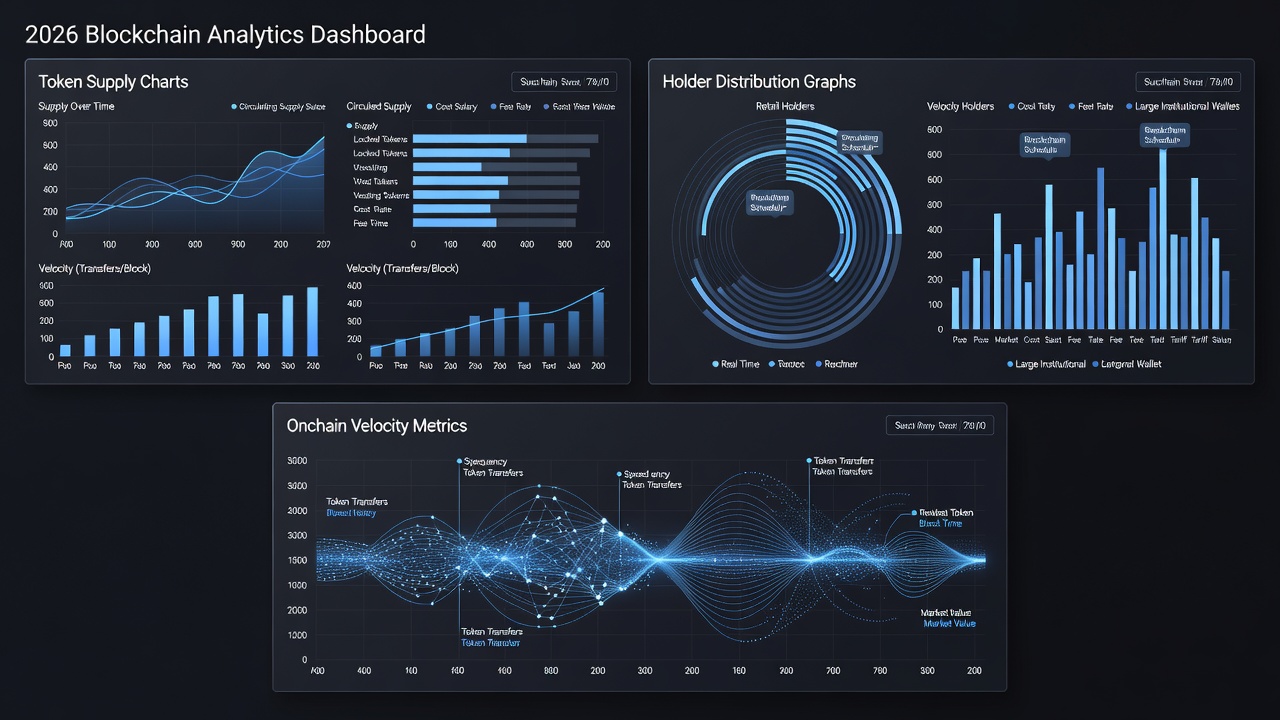
In 2026, evaluating token health requires moving beyond whitepapers and into verifiable onchain data. A comprehensive tokenomics audit examines supply mechanics, holder distribution, utility signals, and economic sustainability using blockchain analytics tools. This approach helps investors, analysts, and project builders identify sustainable tokens while avoiding those with hidden risks. Onchain data provides transparent insights that traditional financial reports cannot match, especially in decentralized ecosystems where token velocity, unlock schedules, and wallet concentrations directly impact long-term viability. The following sections break down each component of the audit process with actionable steps, real-world considerations, and examples drawn from projects active in early 2026.
Selecting Reliable Data Sources
Begin any audit by choosing transparent, up-to-date platforms that aggregate blockchain data across multiple networks. Dune Analytics stands out for its customizable SQL-based dashboards that allow users to query raw transaction data, token transfers, and smart contract interactions without relying on potentially biased third-party summaries. Dune Analytics supports Ethereum, Solana, and several layer-2 chains, making it ideal for cross-network comparisons. Supplement this with DefiLlama, which tracks protocol-level metrics such as total value locked and token supply breakdowns updated daily. DefiLlama provides reliable snapshots that help cross-verify circulating supply claims. Additional tools include Etherscan for contract-level verification on Ethereum mainnet and similar explorers for other chains. Always cross-reference at least three sources to detect discrepancies caused by off-chain reporting or outdated indexing. For ongoing monitoring, set up API integrations or saved queries that refresh automatically every 24 hours.
Tracking Circulating Supply and Holder Distribution
Calculating circulating supply accurately starts with subtracting locked, team-allocated, treasury, and vesting tokens from the total supply reported onchain. Use contract read functions or historical transaction logs to identify addresses holding large locked portions. Healthy projects typically maintain at least 50-70 percent of supply in public circulation with gradual release schedules. Next, analyze holder distribution by querying the top 100 or top 500 addresses. Calculate concentration ratios such as the percentage held by the top 10 wallets. A red flag appears when a small number of addresses control more than 30 percent of circulating supply, as this increases manipulation risk. Tools like Dune allow creation of distribution heatmaps that visualize wallet clusters over time. In practice, review monthly snapshots to detect gradual accumulation by insiders or sudden movements indicating coordinated selling pressure.
Analyzing Utility and Velocity Signals
Token utility becomes visible through onchain activity metrics including transaction counts, staking participation rates, and burn events. Velocity, defined as the average number of times a token changes hands within a period, offers insight into whether the token functions as a medium of exchange or merely speculative asset. Calculate velocity by dividing total transfer volume by average circulating supply over 30 or 90 days. Low velocity combined with rising active addresses often signals strong fundamentals and real usage. High velocity paired with low unique holders may indicate wash trading or speculative loops. Examine governance participation and fee-burning mechanisms to assess whether utility drives demand. For instance, tokens used in decentralized compute networks show consistent staking and reward distribution patterns that correlate with network growth.
Identifying Red Flags: Concentrated Unlocks and Other Risks
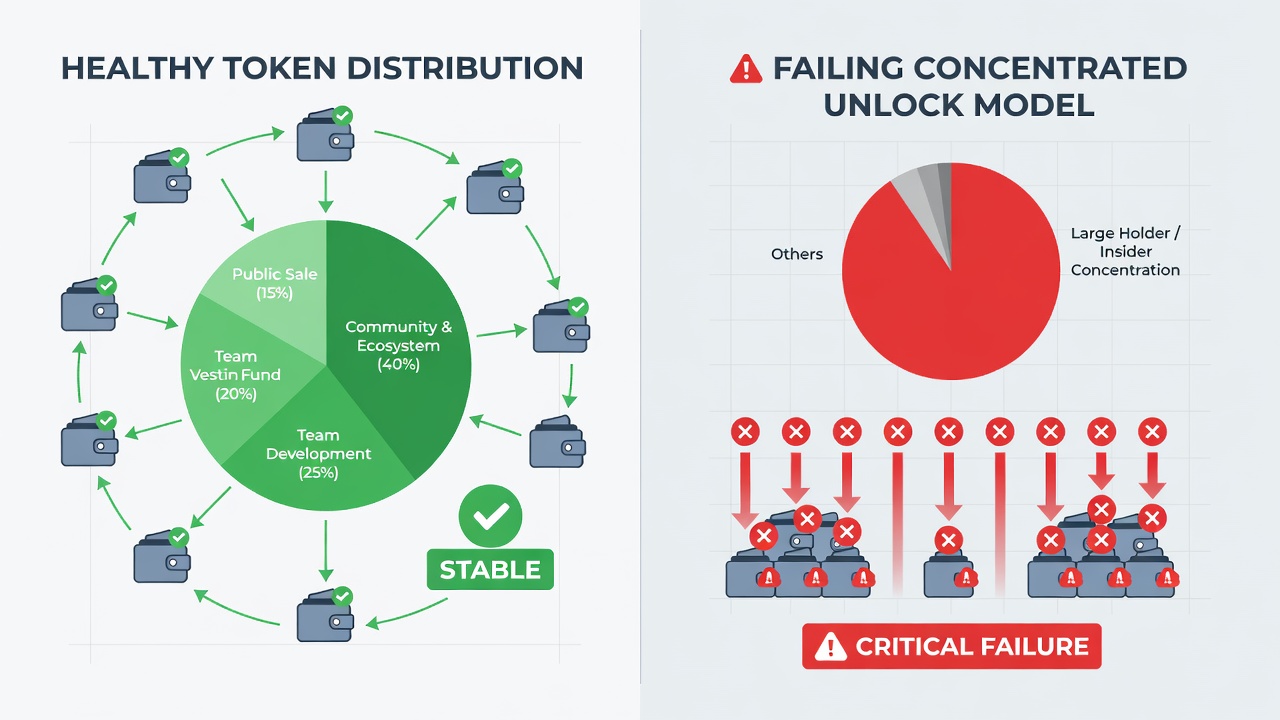
Large scheduled unlocks visible through vesting contract addresses represent one of the most common failure points. Query these contracts for upcoming release dates and monitor the associated wallets for immediate transfer activity after unlocks. Sudden large transfers from team or investor addresses frequently precede price declines. Additional red flags include opaque treasury management, where funds move to unknown exchanges without clear rationale, and mismatched claims between marketing materials and actual onchain data. In 2026, several gaming and AI-related tokens experienced rapid drawdowns after concentrated unlocks occurred without corresponding utility growth. Always compare announced vesting schedules against actual blockchain events to spot hidden extensions or early releases.
Real 2026 Project Examples
Consider Project A, a decentralized AI compute network launched in late 2025. Its audit revealed 65 percent of supply circulating across more than 120,000 unique holders, steady staking rates above 40 percent of circulating supply, and consistent utility through compute job payments. In contrast, Project B, a play-to-earn gaming token, showed 40 percent of supply locked in a small cluster of team and advisor wallets. Post-unlock movements led to a 70 percent price drop within two weeks as concentrated selling overwhelmed demand. A third example, Project C from the decentralized finance sector, maintained balanced distribution but suffered from high velocity caused by frequent trading incentives rather than organic usage, highlighting the need to evaluate both distribution and activity quality.
Side-by-Side Comparison: Healthy vs Failing Models
Healthy token models feature broad holder bases exceeding 50,000 addresses, transparent multi-signature vesting contracts with public schedules, and measurable onchain utility such as staking rewards or payment volumes. Failing models typically display concentrated ownership above 30 percent in top wallets, undisclosed early unlocks, and velocity driven primarily by speculation rather than protocol usage. Comparing these characteristics side by side helps auditors quickly classify new projects during initial screening.
Audit Checklist
- Verify total and circulating supply via multiple explorers and analytics platforms, documenting any discrepancies.
- Map the top 100 holders and calculate concentration percentages, noting any exchange or known entity addresses.
- Review vesting contract transactions for upcoming unlocks and set calendar alerts 30 days in advance.
- Measure token velocity and utility metrics over rolling 90-day windows, comparing against historical baselines.
- Cross-check community and marketing claims against actual onchain movements and holder data.
- Document governance participation rates and any treasury outflows to external addresses.
FAQ
What tools are best for ongoing monitoring?
Combine Dune Analytics dashboards with alerts from Chainalysis or similar services for real-time holder movement tracking. Chainalysis provides institutional-grade onchain intelligence that complements open-source tools.
How often should audits be repeated?
Perform full audits quarterly and lighter checks monthly, especially around known unlock dates or major protocol upgrades.
Can retail investors perform these audits without coding skills?
Yes, many platforms offer pre-built dashboards and no-code interfaces, though basic familiarity with wallet explorers improves accuracy.
Conclusion
Mastering onchain tokenomics audits empowers better decision-making in 2026's maturing market. Consistent application of these steps reveals sustainable projects while filtering out fragile ones built on concentrated control or weak utility. Regular practice with the outlined checklist and data sources builds the analytical edge needed to navigate evolving blockchain economies effectively.


No comments yet. Be the first!