 CryptoChain Blog
Introduction to Decentralized Social Tokenomics in 2026
Decentralized social platforms, often called SocialFi, blend social networking with blockchain incentives to create new economic models. In 2026, onchain analytics provide critical insights into token economics, helping investors and analysts evaluate sustainability and long-term viability. This breakdown focuses on metrics like engagement-driven token flows, creator reward distributions, and staking participation rates derived directly from blockchain data. These platforms reward users for content creation and interaction through native tokens, but success depends on balanced incentive structures that avoid rapid inflation or centralization.
Understanding these elements is essential for assessing whether incentive models drive genuine user growth or merely speculative activity. Leading protocols demonstrate varied approaches, offering real-world lessons for data-backed decision making. Onchain data reveals patterns invisible in traditional social media metrics, allowing precise tracking of value transfer between participants.
Key Onchain Metrics for Token Health
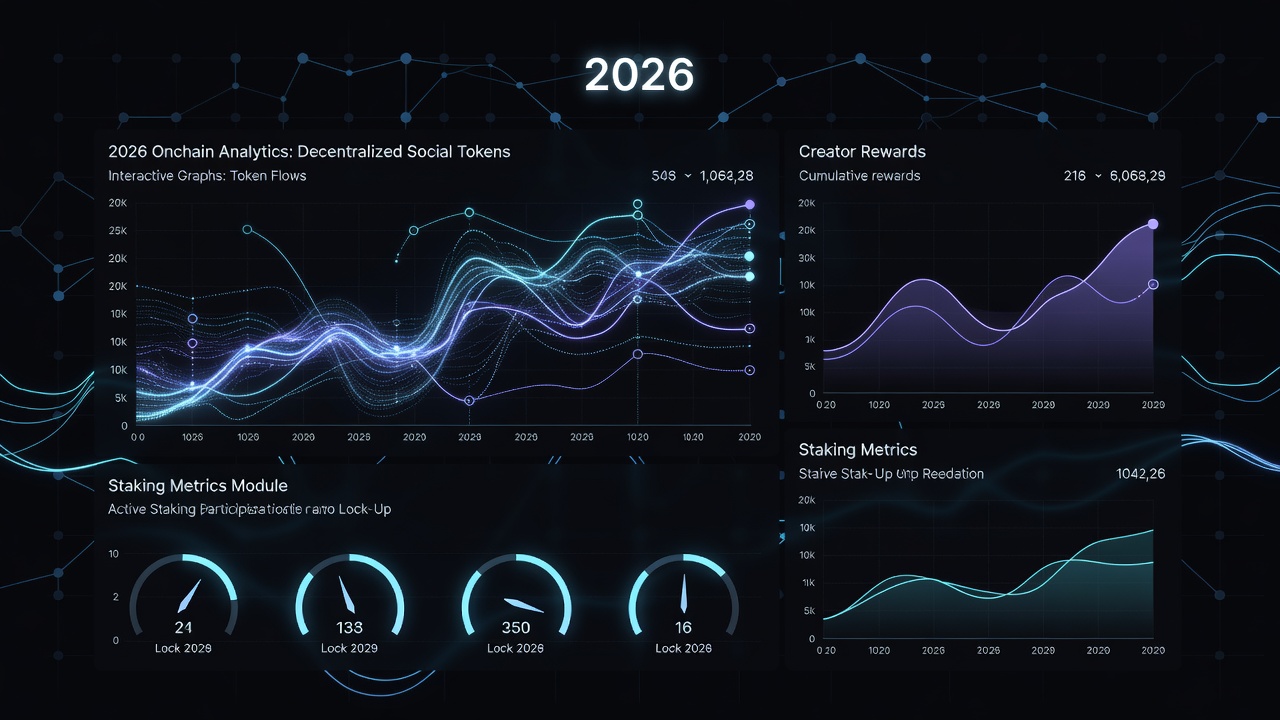
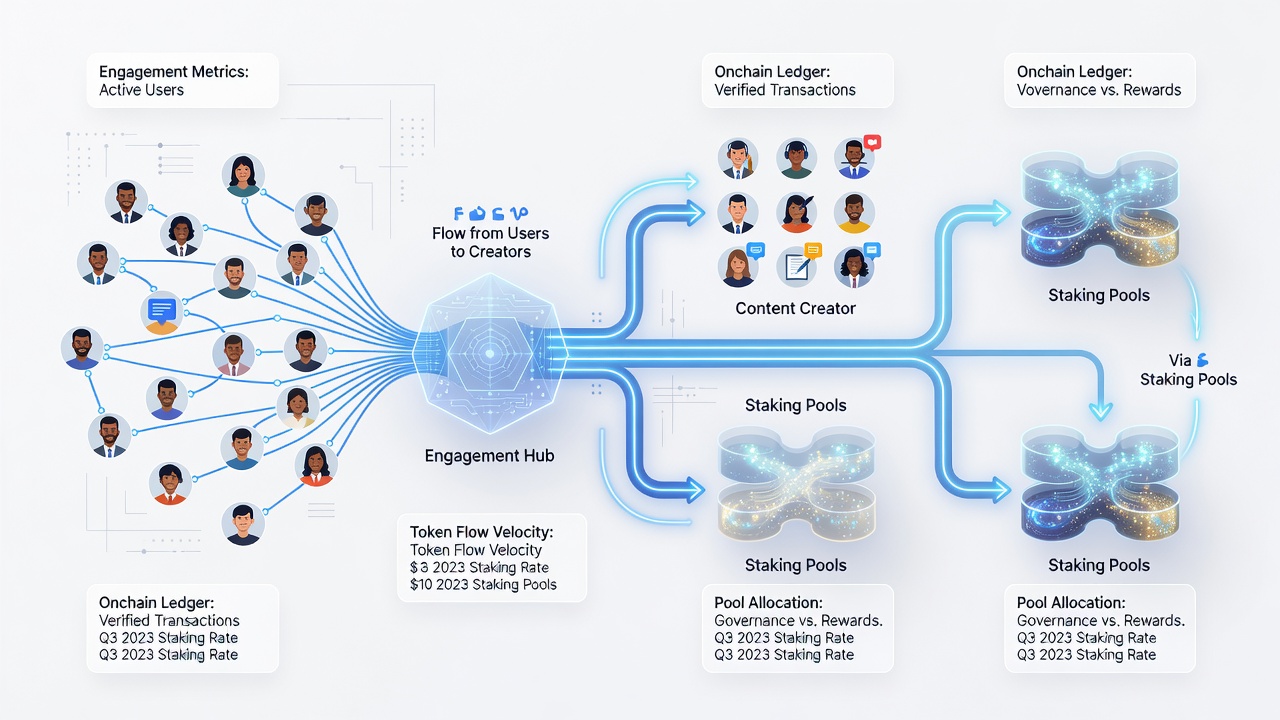
Effective analysis starts with core metrics pulled from public ledgers. Engagement-driven token flows track how rewards move between users based on content interactions such as likes, comments, and shares. Creator reward distributions reveal fairness in payouts by showing the percentage of tokens allocated to top contributors versus the broader community. Staking participation rates indicate long-term commitment as users lock tokens to earn yields or governance rights.
Analysts often examine token velocity alongside these to distinguish between healthy circulation and inflationary pressure. High velocity with low engagement can signal unsustainable models where tokens are traded rapidly rather than used for platform activities. Additional metrics include wallet concentration ratios and reward claim frequencies, which help identify potential manipulation or uneven power distribution across the network.
Step-by-Step Guidance: Tracking Incentives with Analytics Tools
Tracking incentives requires systematic use of available blockchain tools. Begin by selecting a protocol and identifying its token contract address on the relevant chain. Next, query transaction histories to isolate reward events tied to user-generated content. Cross-reference these with on-platform activity indicators where possible to measure real engagement versus artificial inflation.
- Connect to blockchain explorers or dashboards to query transaction data for specific tokens, filtering by event types like reward minting or transfer.
- Filter for user-generated content events, such as posts or likes that trigger rewards, and calculate average reward per interaction.
- Compare incentive outflows to actual on-platform activity logs where available, noting discrepancies that may indicate bot activity.
- Calculate staking ratios by reviewing locked token amounts versus total supply, then segment by wallet size for concentration insights.
- Monitor velocity by dividing transaction volume by circulating supply over time periods, adjusting for seasonal spikes in social activity.
- Export data into visualization software to identify trends and anomalies over multiple months.
Tools like Dune Analytics allow custom queries for these insights without requiring advanced coding skills, empowering both novice and experienced analysts.
Real-World Examples from Leading Protocols
Protocols such as those built on Ethereum have shown how creator rewards tied to engagement can boost retention when distributed through transparent smart contracts. In one case, a platform allocated tokens proportionally to content views, resulting in sustained user growth but requiring careful monitoring of velocity to prevent sell pressure. In contrast, some models on alternative chains prioritize staking, leading to different distribution patterns where long-term holders dominate governance but new user acquisition slows.
Comparisons highlight that engagement-focused systems often reduce token concentration risks compared to pure staking incentives. Another example involves a hybrid protocol that combined both mechanisms, achieving higher staking rates while maintaining active content production. These cases underscore the importance of reviewing historical onchain patterns before committing capital to similar projects.
Comparing Incentive Models
Different incentive models produce distinct outcomes in decentralized social environments. Engagement-based models reward immediate interactions, promoting active communities but risking short-term farming behavior where users create low-quality content for quick gains. Staking-centric models encourage holding yet may limit new user onboarding by creating high barriers to entry for rewards.
- Engagement-based: Rewards scale with interactions, promoting active communities but risking short-term farming.
- Staking-centric: Encourages holding yet may limit new user onboarding and reduce overall token circulation.
- Hybrid approaches: Combine both for balanced velocity and participation, often yielding more resilient ecosystems.
- Linear versus tiered rewards: Linear models distribute evenly while tiered systems favor top performers, affecting overall decentralization.
Investors should review historical onchain patterns to identify which model aligns with project goals and risk tolerance.
Practical Advice on Using Analytics Tools Effectively
Beyond basic queries, advanced users integrate multiple data sources for comprehensive views. Combining onchain metrics with off-chain social signals provides context, such as correlating reward claims with actual post performance. Common mistakes include overlooking gas fee impacts on small transactions or failing to account for token unlocks that temporarily distort supply metrics. Regular monitoring intervals, such as weekly reviews, help detect shifts early.
Resources from established blockchain foundations offer tutorials on building reliable dashboards, ensuring analysts avoid common data interpretation errors.
FAQ: Common Red Flags in SocialFi Tokenomics
What indicates concentrated token holdings?
Large portions of supply held by a few wallets often precede volatility. Track distribution via onchain explorers for transparency and set alerts for sudden transfers from large holders.
How does high token velocity affect sustainability?
Elevated velocity without corresponding engagement growth typically points to speculative trading rather than organic use, eroding trust in the incentive system over time.
Are there reliable benchmarks for staking rates?
Compare rates against similar protocols using aggregated data sources to spot outliers, focusing on sustained participation rather than one-time peaks.
What are signs of reward farming?
Repeated low-effort content paired with disproportionate reward claims signals potential abuse, often visible through clustering of wallet behaviors on the ledger.
2026 Outlook and Emerging Trends
As decentralized social platforms mature, expect greater emphasis on verifiable onchain reputation systems that tie rewards more closely to quality interactions. Integration with layer-two solutions may lower costs and increase accessibility, while improved analytics interfaces will democratize access to these insights. Analysts who master these tools now will be better positioned to identify sustainable projects amid evolving market conditions.
Conclusion
Onchain analytics empower deeper evaluation of decentralized social tokenomics. By focusing on engagement flows, rewards, and staking, analysts gain actionable insights into 2026 models. Apply these methods to emerging platforms for informed investment strategies and long-term success in the SocialFi space.

No comments yet. Be the first!