 CryptoChain Blog

Introduction to Decentralized Storage Tokenomics
Decentralized storage networks have matured significantly by 2026, with token economics playing a central role in sustainability and growth. This case study analyzes onchain metrics from leading protocols to uncover how token utility, supply mechanics, and user adoption signals interact. Readers will gain practical frameworks for assessing these models beyond typical DeFi narratives. Blockchain analytics provide transparent views into staking volumes, reward distributions, and transaction patterns that traditional reports often miss. By examining 2026 data, we identify patterns that indicate long-term viability in storage-focused tokens. The shift toward verifiable data availability has made onchain insights essential for distinguishing projects with robust economics from those vulnerable to speculative cycles.
Core Components of Token Utility in Storage Networks
Token utility extends beyond simple payments for storage space. In mature networks, tokens facilitate governance decisions, collateral for node operators, and incentives for data retrieval. Onchain analysis shows that protocols integrating multiple utility layers tend to exhibit steadier demand curves during market fluctuations. For instance, utility tied directly to data persistence creates recurring usage rather than one-time transactions. This design encourages holders to actively participate in network health instead of speculative holding alone. Additional utilities include bandwidth prioritization and dispute resolution mechanisms, which further embed the token within daily operations. Projects that evolve utility over time through community governance demonstrate stronger resilience, as evidenced by sustained active address growth in 2026 datasets.
Supply Dynamics and Inflation Mechanics Observed in 2026
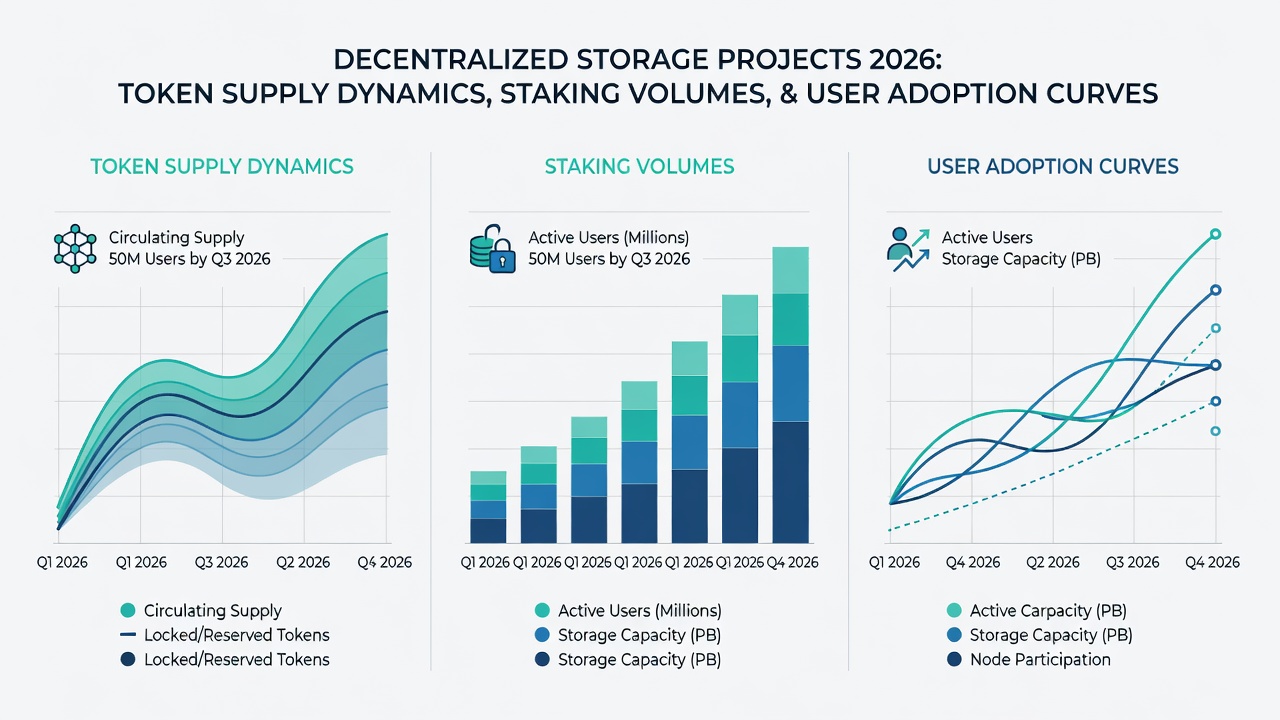
Supply schedules in decentralized storage tokens often incorporate halving events or decay curves to control inflation. Onchain data from early 2026 reveals how circulating supply growth correlates with node onboarding rates. Projects that align emission schedules with actual storage demand demonstrate better retention of validator participation. Key signals include the ratio of locked tokens versus liquid supply and the velocity of token movement between storage providers and end users. These metrics help distinguish sustainable models from those reliant on continuous issuance. Further examination shows that vesting schedules for early investors and team allocations significantly influence sell pressure, with transparent cliffs leading to more predictable market behavior.
Real-World Case Studies from Leading Projects
Filecoin continues to serve as a benchmark, with onchain analytics highlighting robust deal-making activity and storage power distribution. Its token model ties rewards to verified storage capacity, creating direct links between utility and network value. Detailed explorer data illustrates how sector-specific deals in enterprise archiving have driven consistent token circulation. Arweave employs a unique endowment mechanism where upfront payments fund perpetual storage. 2026 onchain flows indicate strong adoption in archival use cases, with token burns providing deflationary pressure during high-demand periods. This approach has attracted institutional users seeking immutable records. Storj differentiates through its focus on enterprise-grade encryption and S3 compatibility. Analytics show higher average transaction values per user compared to consumer-focused alternatives, reflecting different adoption segments. A fourth example, Sia, emphasizes user-controlled storage contracts with custom pricing, where onchain smart contracts reveal flexible incentive tuning that adapts to regional demand variations.
Comparing Incentive Structures Across Protocols
- Reward Distribution: Linear versus exponential models affect provider retention; onchain data favors balanced approaches that avoid early concentration of power among large operators.
- Slashing Conditions: Protocols with clear, enforceable penalties for downtime maintain higher uptime averages according to 2026 metrics, reducing the risk of widespread data loss events.
- Governance Participation: Tokens granting meaningful voting rights on storage parameters show increased holder engagement in onchain proposals, fostering iterative improvements.
- Collateral Requirements: Higher collateral thresholds correlate with professional-grade providers but can limit entry for smaller participants, creating trade-offs visible in network diversity statistics.
Step-by-Step Methods for Evaluating Sustainability
- Map token flows from issuance to end-user consumption using public blockchain explorers to identify bottlenecks in distribution.
- Calculate the percentage of supply actively securing storage deals versus idle holdings to gauge real economic activity.
- Assess correlation between token price movements and actual network utilization metrics such as total stored data volume.
- Review historical slashing events and their impact on provider behavior to understand risk management effectiveness.
- Project future emission impacts under varying adoption scenarios, incorporating stress tests for low-demand periods.
- Analyze cross-chain bridges and liquidity pools for hidden dependencies that could affect token stability.
User Adoption Signals from Onchain Data
Beyond basic metrics, adoption signals emerge from patterns like repeat storage deal renewals and geographic distribution of nodes. In 2026, protocols with strong developer tooling saw accelerated growth in unique wallet interactions tied to storage uploads. Monitoring active contracts and retrieval success rates provides forward-looking indicators of user retention that price action alone cannot reveal. These signals often precede broader market recognition by several months.
Practical Tools for Tracking Onchain Flows
Analysts rely on platforms such as Dune Analytics for custom dashboards and Filecoin network explorers for granular deal data. Combining these with Arweave block explorers allows cross-protocol comparisons of token velocity and active addresses. Additional resources include protocol-specific APIs that export raw event logs for advanced modeling. Regular monitoring of these sources reveals early warning signs like sudden drops in active storage providers or spikes in unstaked tokens.
Common Pitfalls in Storage Token Models
Overly aggressive emission schedules often lead to sell pressure that outpaces organic demand. Another frequent issue is misaligned incentives where rewards favor short-term node registration over long-term data availability. Projects that fail to update token parameters in response to onchain feedback risk losing community trust. Additional pitfalls include insufficient auditing of smart contract reward logic and neglecting regional regulatory impacts on token classification. Avoiding these pitfalls requires transparent governance and regular metric reviews rather than static token designs.
Conclusion
2026 onchain analytics underscore that successful decentralized storage tokenomics balance utility, controlled supply, and adaptive incentives. By applying the evaluation methods and tools outlined, analysts and investors can better navigate this specialized segment of Web3 infrastructure. Continued observation of evolving metrics will remain critical as these networks scale.

No comments yet. Be the first!