 CryptoChain Blog
Introduction to Solana and Ethereum Tokenomics
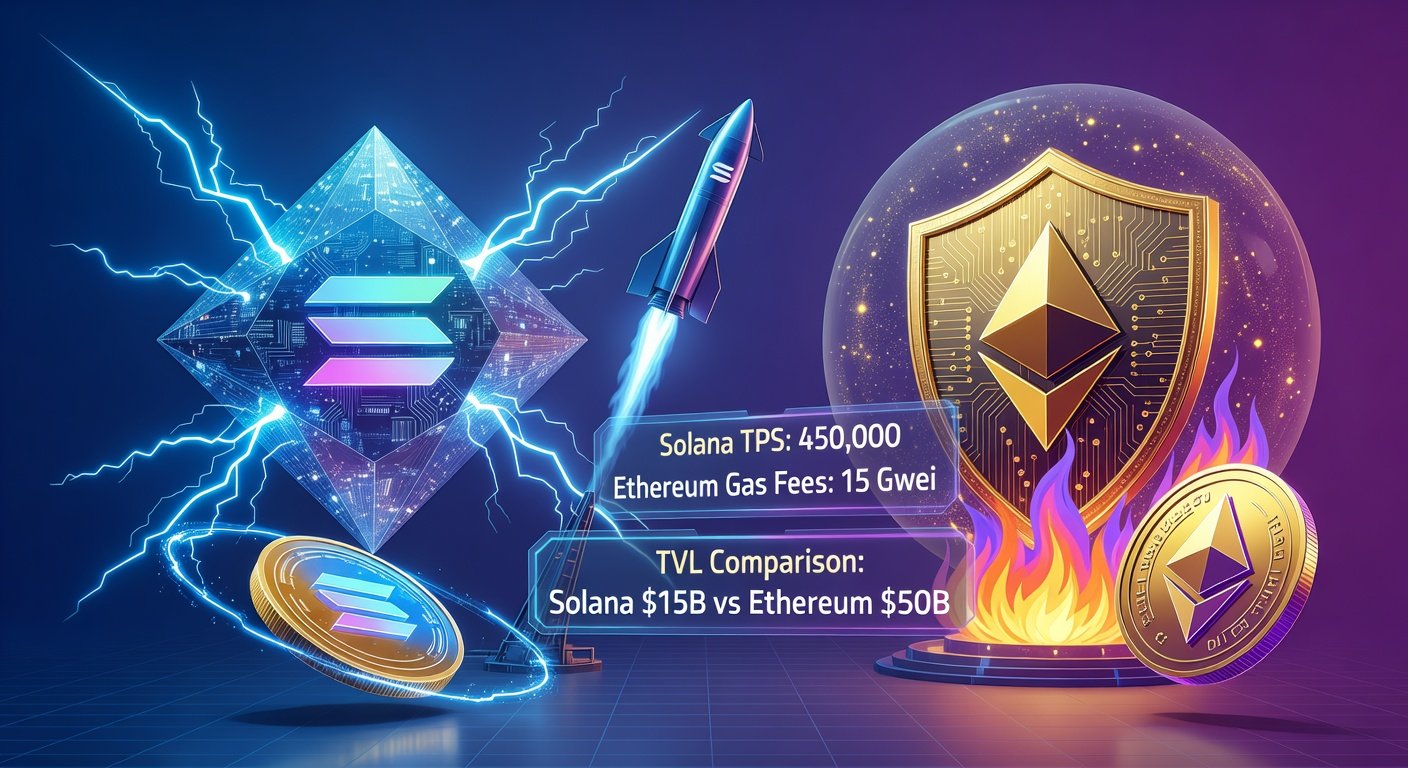
In the ever-evolving world of layer-1 blockchains, tokenomics—the economic model governing a cryptocurrency's supply, distribution, and utility—plays a pivotal role in determining long-term success. As we project into 2026, onchain analytics reveal stark contrasts between Solana (SOL) and Ethereum (ETH). Solana's high-throughput design contrasts with Ethereum's battle-tested security and deflationary mechanics post-Merge. This comparison leverages blockchain analytics from tools like Dune and DefiLlama to dissect supply dynamics, token velocity, and whale activity, offering investors actionable insights on price stability and ecosystem adoption.
Why does this matter? Tokenomics directly influences price volatility, investor confidence, and real-world utility. With Ethereum's market dominance and Solana's rapid growth, understanding these metrics helps evaluate which L1 might outperform in a maturing crypto market.
Understanding Key Tokenomics Metrics
Before diving into comparisons, let's define the core metrics:
- Supply Dynamics: Total supply, inflation rates, issuance schedules, and burn mechanisms that control scarcity.
- Token Velocity: How quickly tokens circulate, calculated as transaction volume divided by market cap. High velocity can pressure prices downward.
- Whale Activity: Concentration of holdings among large holders (>1% of supply), tracked via onchain transfers and accumulation patterns.
These factors interplay to affect price stability—scarcity drives value, low velocity supports holding, and balanced whale behavior signals maturity.
Supply Dynamics: Inflation vs. Deflation in 2026
Ethereum's supply model has transformed since The Merge in 2022, shifting to proof-of-stake with EIP-1559 burns. By 2026 projections from onchain data, ETH's annual inflation hovers around 0.5-1%, thanks to ~$10-15B in annual burns from high network fees during bull markets. Ultrasound Money dashboards show ETH supply contracting during peak usage, enhancing scarcity.
Solana, conversely, maintains an inflationary model with ~5-6% annual issuance to reward validators, offset partially by transaction fees and Jito MEV burns. Onchain analytics from Solana's official site and Solscan indicate total supply reaching 600M+ SOL by 2026, with burns ramping up via Firedancer upgrades but still net inflationary. This dilutes value unless demand surges.
| Metric | Ethereum (ETH) | Solana (SOL) |
|---|---|---|
| 2026 Projected Inflation | 0.5-1% (deflationary peaks) | 4-6% net |
| Burn Mechanism | EIP-1559 (fee-based) | Tx fees + MEV |
| Total Supply | ~120M (stable) | ~600M+ |
This table highlights Ethereum's edge in scarcity, crucial for price floors during bear markets.
Token Velocity: Circulation Speed and Price Pressure
Token velocity measures economic activity: high velocity (fast circulation) erodes holding value, while low velocity encourages HODLing.
Ethereum's velocity in 2026 is projected at 0.4-0.6 (per DefiLlama TVL-adjusted metrics), driven by DeFi staking (e.g., Lido, Rocket Pool) locking 30%+ of supply. Onchain data shows ETH's velocity dropping during L2 booms, as rollups like Optimism reduce mainnet txs but boost overall utility.
Solana's velocity spikes to 1.2-1.8, fueled by memecoin frenzy and high TPS (65,000+). Platforms like Pump.fun accelerate turnover, but this creates boom-bust cycles. Analytics from Dune queries reveal SOL's velocity correlating with retail hype, pressuring prices post-pumps.
- Ethereum Advantage: Staking reduces velocity, stabilizing prices.
- Solana Risk: High velocity amplifies volatility, ideal for traders but risky for long-term holders.
Whale Activity: Onchain Patterns Shaping Markets
Whales—addresses holding >0.1% supply—dictate sentiment. Ethereum's top 100 wallets control ~35% of supply (per Etherscan), but diversified across institutions (Grayscale, BlackRock ETFs). 2026 onchain trends show reduced whale dumps during dips, with accumulation via spot ETFs.
Solana whales are more concentrated (~45% in top 100), per Solscan, dominated by VCs and early insiders. Recent data highlights whale rotations into memecoins, causing 20-50% drawdowns. However, Solana's Firedancer and ZK compression could attract institutional inflows, diluting whale power.
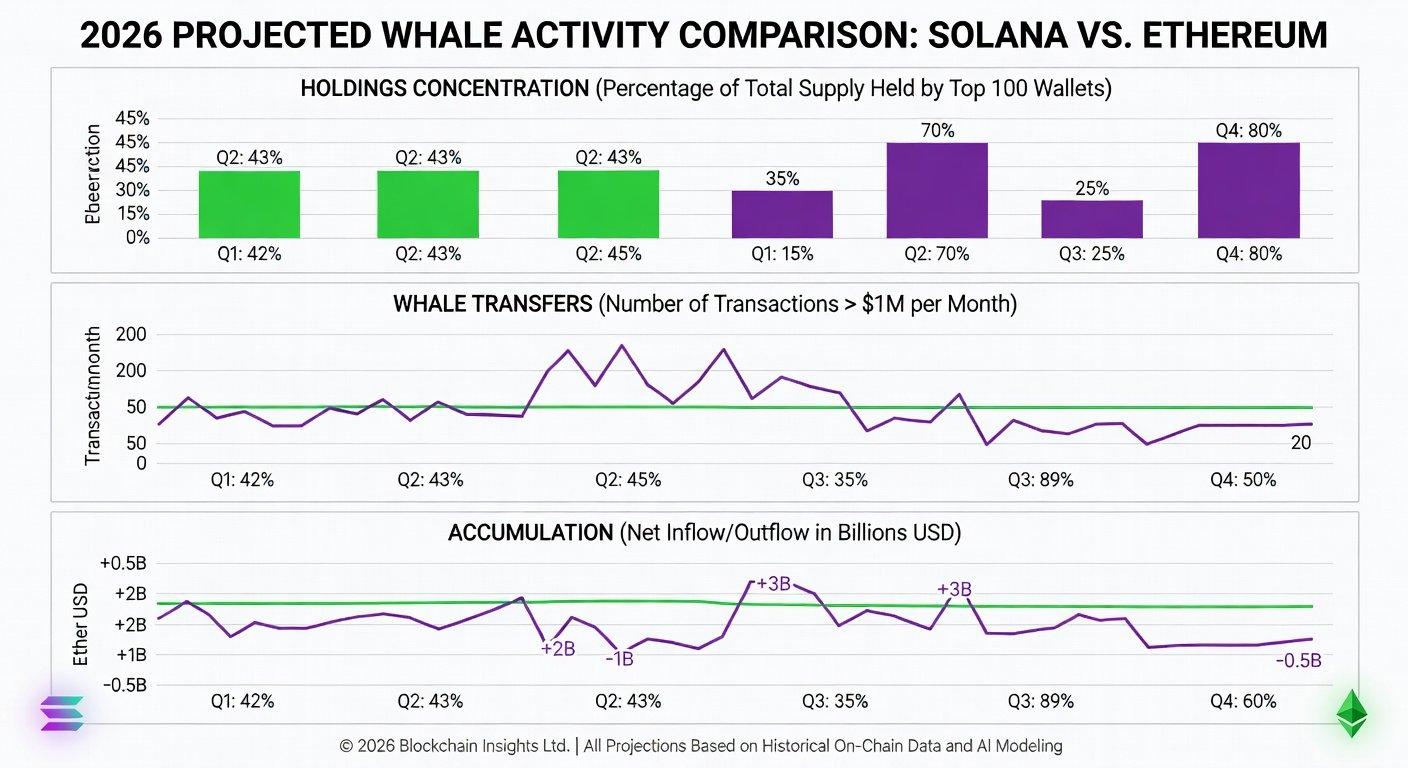
Visualizing whale distribution: Ethereum's balanced holdings vs. Solana's concentrated power (hypothetical 2026 onchain chart).
Key Whale Metrics Comparison
- Accumulation Score: ETH +15% YTD 2025 (projected), SOL +8% amid volatility.
- Large Transfer Volume: SOL 2x ETH's, signaling speculation.
- Exchange Inflows: Lower for ETH, supporting price stability.
Impact on Price Stability and Adoption
Ethereum's tokenomics foster stability: deflationary supply + low velocity = resilient floors (e.g., $2K+ in bears). Adoption surges via L2s (Base, Arbitrum), with 2026 TVL projected at $200B+ on DefiLlama.
Solana excels in adoption speed—10M+ daily users via apps like Jupiter DEX—but high velocity and inflation cap stability. Price swings (e.g., 2024's 90% drawdown recovery) attract degens, yet institutional hesitation persists due to outage history.
Differences Summary:
- Price Stability: ETH wins (beta 0.8 vs. SOL's 1.5 to BTC).
- Adoption: SOL leads retail (TPS edge), ETH enterprise (EVM standard).
Actionable Insights for Investors
For L1 portfolio allocation in 2026:
- Analyze Onchain Tools: Use Dune.com for custom dashboards tracking velocity/whales. Query ETH burns vs. SOL emissions weekly.
- Diversify Based on Risk: 60% ETH for stability, 40% SOL for growth. Monitor ETF inflows via CoinGecko.
- Avoid Common Mistakes: Don't chase SOL pumps without checking whale outflows; ignore ETH FUD during L2 migrations.
- Long-Term Plays: Stake ETH for 4% APY; farm SOL LP on Raydium cautiously.
Investment Framework:
- Stability Seekers: ETH (supply + velocity edge).
- Growth Chasers: SOL (if outages resolve).
- Hybrid: Dollar-cost average both, rebalance on velocity spikes.
Conclusion
By 2026, Ethereum's mature, deflationary tokenomics position it as the stability king, while Solana's high-velocity model drives explosive adoption at higher risk. Onchain analytics underscore ETH's price resilience and SOL's speculative upside. Investors should blend both, using tools like Dune and DefiLlama for data-driven decisions. As L1 wars intensify, tokenomics will separate winners from pretenders—position accordingly.

No comments yet. Be the first!