 CryptoChain Blog
Introduction to Stablecoin Adoption in 2026
Stablecoin adoption continues to accelerate as onchain tokenomics provide clearer signals of real usage. In 2026, metrics such as active addresses, retention curves, and cross-chain flows reveal how these assets integrate into both retail and institutional finance. This article examines key indicators drawn from public blockchain data to help readers interpret adoption trends accurately. Onchain analytics offer transparent views that traditional financial reports cannot match, allowing anyone with internet access to track supply movements, holder behavior, and protocol integrations in near real time. Understanding these signals helps investors, developers, and policymakers separate sustainable growth from short-term noise.
Core Onchain Metrics for Tracking Adoption
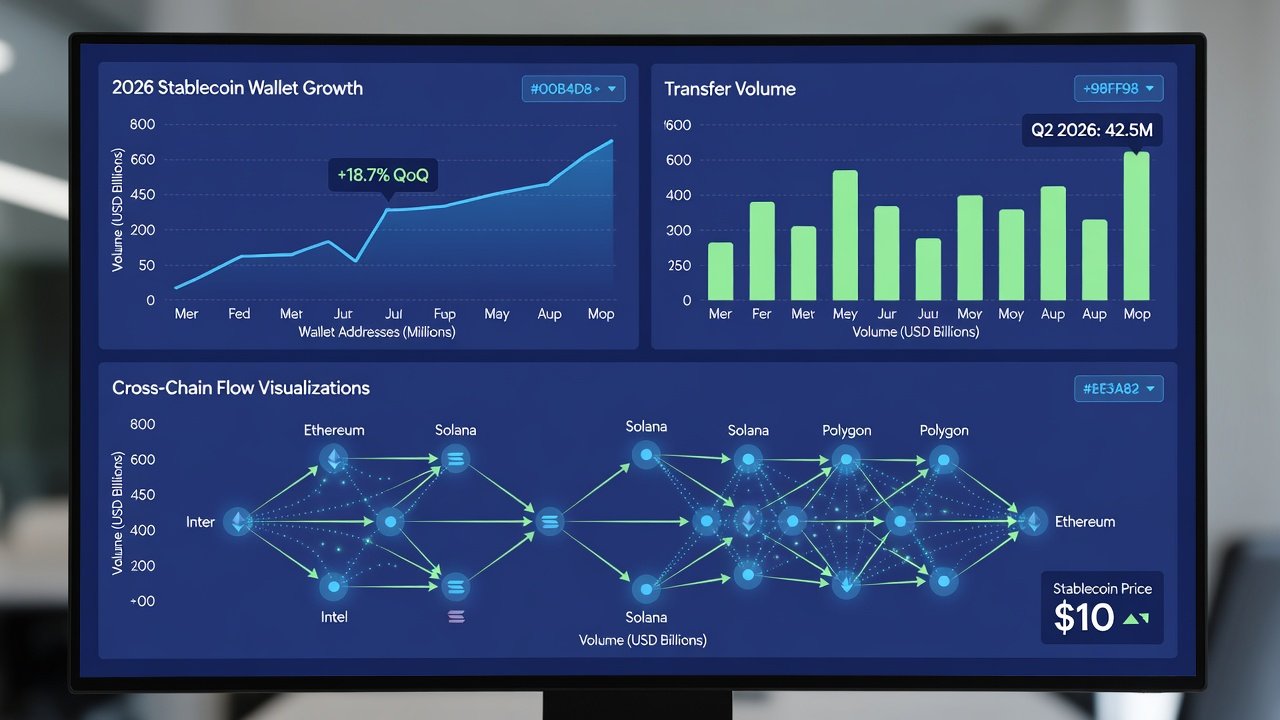
Wallet growth serves as a foundational metric. Analysts monitor the number of addresses holding stablecoins above minimal thresholds to filter out dust and inactive accounts. Transfer volumes highlight liquidity movement across networks, while velocity shifts indicate whether tokens are used primarily for payments, trading, or held as long-term reserves. Active addresses provide a daily snapshot of engagement, showing how many unique wallets interact with stablecoins on any given day. Retention curves track how long users maintain balances after initial acquisition, revealing stickiness in different market conditions. For example, a retention curve that remains above 40 percent after 90 days often signals strong product-market fit in payments applications.
Understanding Wallet Growth and Active Addresses
Wallet growth metrics require careful segmentation. New addresses entering the ecosystem may represent first-time users or simply new wallets created by existing holders. Analysts typically examine addresses with balances exceeding $10 to focus on meaningful participation. In 2026, public data from major chains shows steady increases in active addresses for leading stablecoins, particularly on high-throughput networks. Cross-referencing address growth with transaction counts helps identify organic adoption versus temporary farming activity. Tools that label addresses by entity type further refine these insights by distinguishing exchange hot wallets from individual user addresses.
Analyzing Transfer Volumes and Velocity
Transfer volumes measure the total value moved onchain within specific timeframes. High volumes paired with low average transaction sizes often indicate retail payment usage, whereas large, infrequent transfers point to institutional treasury activity. Velocity, calculated as total transfer volume divided by average circulating supply, offers a key indicator of usage intensity. A rising velocity trend suggests tokens are circulating more actively rather than sitting idle in wallets. When interpreting velocity, analysts must account for seasonal effects and major events such as regulatory announcements or macroeconomic shifts that temporarily alter behavior.
Retention Curves Explained with Practical Examples
Retention curves plot the percentage of users who remain active over successive periods after their first interaction. To build these curves, cohort users by the week or month of their initial stablecoin receipt and track subsequent balance changes. A healthy curve shows gradual decay with repeated top-ups, indicating ongoing utility. In contrast, sharp drop-offs after the first week frequently appear during speculative inflows. Real blockchain examples from 2026 demonstrate that stablecoins integrated into payroll or remittance applications maintain higher retention than those used primarily for trading. Developers can replicate these analyses using open datasets from blockchain indexers to benchmark their own protocols.
Step-by-Step Guidance on Extracting Adoption Signals
- Access public dashboards such as those on DefiLlama to pull stablecoin supply and volume data across multiple chains.
- Query blockchain explorers like Etherscan for address activity over rolling 30-day windows, applying filters for minimum balance and transaction count.
- Calculate retention by segmenting cohorts based on first transaction date and measuring balance persistence at 7, 30, and 90 days.
- Compare velocity by dividing total transfer volume by average circulating supply across Ethereum, Solana, and Layer-2 networks.
- Interpret shifts by cross-referencing with DeFi protocol TVL data from sources including Dune Analytics and onchain labeling services.
- Validate findings against issuer transparency reports to confirm supply figures and rule out data anomalies.
These steps allow users to isolate genuine adoption from speculative spikes while building reproducible workflows.
Cross-Chain Flows and DeFi Integration
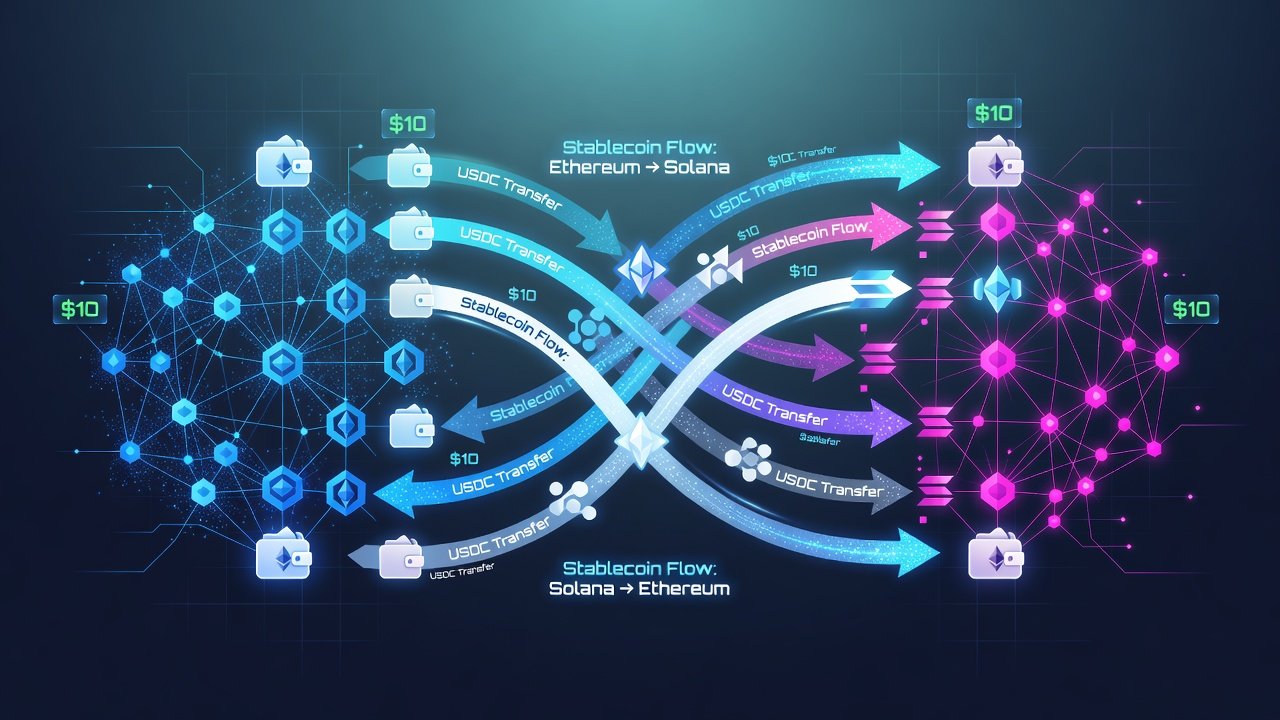
Stablecoins move seamlessly across networks, with flows between Ethereum, Solana, and emerging Layer-2 solutions indicating ecosystem maturity. Integration with lending protocols and decentralized exchanges amplifies utility, as seen in repeated bridging activity and collateral usage. Monitoring bridge inflows and outflows reveals which chains attract new capital and which lose liquidity. DeFi protocols that accept stablecoins as collateral or for trading pairs often drive the highest volumes. In 2026, cross-chain analytics show increasing activity on networks offering lower fees and faster finality, shifting adoption patterns away from legacy high-cost chains.
Institutional Versus Retail Holder Patterns
Institutional holders typically exhibit larger average balances and lower transfer frequency, often tied to treasury management and settlement activities. Retail patterns show higher velocity with smaller, more frequent transactions linked to payments, remittances, and trading. Case studies from major issuers like Circle and Tether illustrate these differences clearly. Corporate treasuries anchor liquidity by maintaining steady large balances, while retail drives payment use cases through repeated small transfers. Public issuer reports combined with onchain labeling tools help differentiate these cohorts without relying on off-chain KYC data. For instance, addresses associated with known custodians display predictable weekly patterns, whereas retail clusters show higher weekend activity.
Interpreting Velocity Shifts and Common Pitfalls
Velocity increases can signal rising transactional demand, yet sudden spikes sometimes reflect temporary arbitrage or one-off events rather than sustained adoption. Common forecasting errors include ignoring chain-specific fee dynamics, overlooking multi-chain wallet overlaps that inflate address counts, and failing to normalize for token splits or upgrades. Another frequent mistake is extrapolating short-term volume surges without checking retention data. Analysts should always validate signals against multiple independent data sources and consider external factors such as regulatory changes or macroeconomic events to avoid over-optimistic projections.
FAQs on Forecasting Adoption Trends
How reliable are public dashboards for long-term predictions?
Public dashboards offer transparent, real-time views but require careful normalization for chain migrations, token upgrades, and changes in data indexing methodologies.
What distinguishes healthy retention from temporary holding?
Healthy retention shows gradual decay curves with repeated top-ups and consistent transaction patterns, while temporary holding features sharp drop-offs after initial inflows often linked to incentives.
Can cross-chain data alone predict institutional interest?
Cross-chain flows provide useful context but should be combined with velocity, retention, and DeFi integration metrics for a complete picture of institutional participation.
How do fee changes on Layer-2 networks affect stablecoin metrics?
Lower fees typically boost transfer volumes and active addresses while improving retention, as users experiment more freely with smaller transactions.
Should analysts weight all chains equally when calculating aggregate adoption?
No. Weighting by economic activity, total value locked, and user base provides more accurate aggregate views than simple averages across disparate networks.
Conclusion
By systematically analyzing wallet growth, transfer volumes, retention curves, velocity shifts, and cross-chain activity, observers gain actionable insights into 2026 stablecoin tokenomics. Consistent application of these methods, supported by public dashboards and reproducible analytical steps, supports more accurate trend forecasting and strategic decision-making in the evolving onchain economy. Readers who apply the outlined frameworks will be better positioned to identify genuine adoption signals amid market noise.
No comments yet. Be the first!