 CryptoChain Blog
Introduction to Stablecoin Peg Monitoring in 2026
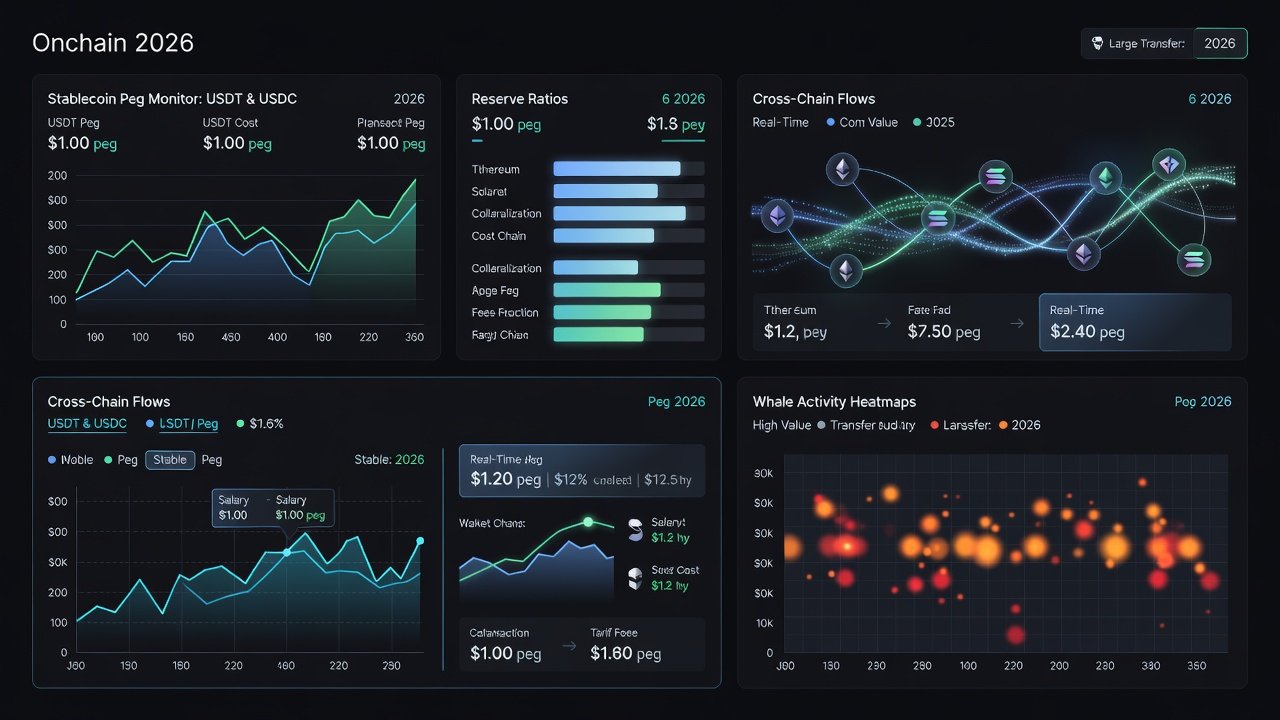
Stablecoins like USDT and USDC remain foundational to DeFi, yet peg deviations continue to pose risks for traders, liquidity providers, and tokenomics researchers. In 2026, effective defense relies on real-time onchain analysis of mint and burn events, reserve ratios, cross-chain flows, and large holder movements. This guide delivers practical workflows, dashboards, and checklists to detect threats before they escalate into full depegs. Analysts must integrate data from multiple chains because stablecoin activity now spans Ethereum, Tron, Solana, and emerging Layer 2 networks, creating complex flow patterns that require constant vigilance.
Core Metrics for Peg Health Assessment
Reserve ratios provide the first line of defense. Analysts track the ratio of onchain reserves to circulating supply using data from issuers and blockchain explorers. A healthy ratio typically stays above 1.0, but deviations signal potential issues. Cross-chain velocity measures how quickly tokens move between networks such as Ethereum, Tron, and Solana, signaling potential stress when velocity spikes without corresponding demand. High velocity can indicate arbitrage or panic selling across bridges.
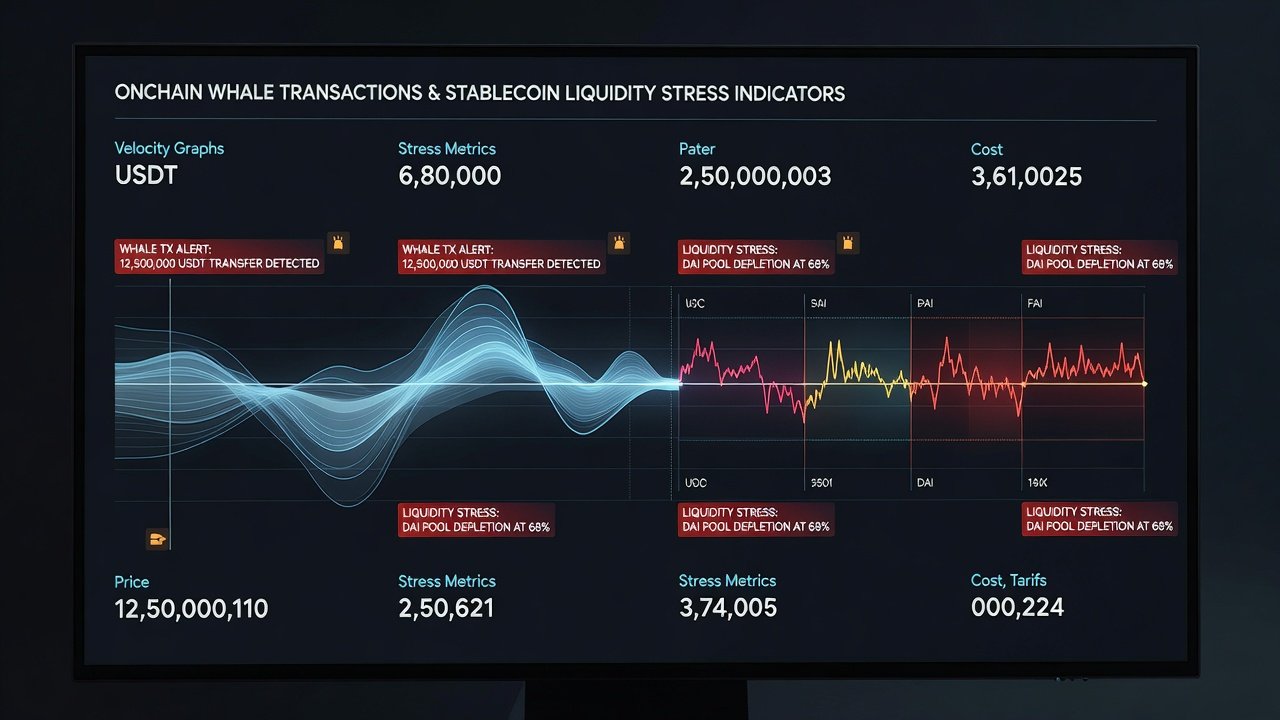
Whale activity tracking focuses on addresses holding over 1% of supply, monitoring their transfer patterns for coordinated exits or accumulations. Additional liquidity stress indicators include pool depth on major DEXes and the frequency of large redemptions at issuer portals. These metrics together form a comprehensive early-warning system. To calculate reserve ratios in practice, query total supply via token contracts and cross-reference with issuer attestations published monthly. Cross-chain velocity requires aggregating transfer volumes over 24-hour periods and comparing against 30-day baselines for anomaly detection.
USDT and USDC Case Studies
USDT on Tron has historically shown faster cross-chain velocity during market stress compared to Ethereum-based holdings. In contrast, USDC benefits from transparent attestations published by Circle, allowing direct comparison of reserves against onchain supply. Recent events demonstrated that whale transfers exceeding 50 million tokens often preceded minor peg wobbles, giving analysts time to adjust positions. For USDT, monitoring Tron-specific burn events proved critical during periods of high redemption pressure, as large burns without corresponding mints on other chains highlighted liquidity drains. USDC case studies reveal that reserve ratio compression often aligns with macroeconomic news, making integration of external data feeds valuable alongside onchain metrics. By combining issuer transparency reports with onchain queries, researchers identified reserve ratio drops below 1.02 as a reliable precursor to temporary depegs in both assets. These examples underscore the need for chain-specific dashboards that flag divergences early.
Step-by-Step Alert Configurations
Begin by connecting a monitoring tool to relevant RPC endpoints for Ethereum, Tron, and Solana. Set thresholds for mint and burn events exceeding 10 million tokens within a one-hour window. Configure alerts for reserve ratio changes greater than 0.5% daily and cross-chain velocity increases above the 90-day average. Add whale movement notifications for transfers over 20 million tokens to exchange or bridge contracts. Advanced setups include webhook integrations that trigger automated position reductions when multiple signals fire simultaneously. Test configurations during low-volatility periods to avoid alert fatigue, and refine thresholds based on historical depeg data from the past year.
Dashboard Templates and Visualization
Effective dashboards combine time-series charts for reserve ratios, flow Sankey diagrams for cross-chain activity, and heatmaps for whale concentration. Include a liquidity stress gauge that aggregates pool depth and redemption volume. Update these views every 15 minutes during volatile periods to maintain situational awareness. A sample template starts with a top-level overview panel showing current peg deviation percentages, followed by drill-down sections for each metric. Visual cues such as color-coded alerts (green for stable, yellow for caution, red for high risk) help prioritize responses. Analysts can replicate these using open-source charting libraries connected to indexed onchain data sources.
Automated Tools Versus Manual Queries
Automated platforms deliver speed and breadth by continuously scanning multiple chains and issuers. They excel at real-time aggregation but may miss nuanced context in complex transactions. Manual queries using blockchain explorers or custom scripts offer deeper customization for specific hypotheses, such as tracing multi-hop flows through mixers or bridges. Analysts often combine both approaches: automated alerts surface anomalies, while manual investigation validates root causes through detailed transaction tracing. For instance, an automated tool might flag a velocity spike, prompting a manual review of the originating wallets to determine if the activity stems from legitimate trading or coordinated selling pressure.
Risk Signals That Precede Depegs
- Sudden increase in burn transactions without matching mint activity across chains
- Reserve ratio compression below historical norms sustained for more than four hours
- Whale outflows to centralized exchanges exceeding average daily volume by 200%
- Cross-chain velocity divergence between major networks lasting over six hours
- Spike in redemption requests at issuer portals coinciding with onchain supply reductions
- Bridge contract inflows without corresponding DEX liquidity additions
Actionable Checklists for Analysts
- Verify current reserve attestations from official issuer sources such as Tether and Circle
- Run onchain queries for mint/burn deltas over the past 24 hours using indexed platforms like DefiLlama
- Map whale wallet movements across chains and flag any concentration above 5% of daily volume
- Assess liquidity depth on primary trading pairs and note any pool imbalances
- Document velocity anomalies and set follow-up alerts for continued monitoring
- Review historical depeg events for pattern matching and update thresholds accordingly
- Cross-reference external market data with onchain flows to contextualize signals
- Simulate response scenarios using historical datasets before live deployment
Common Pitfalls to Avoid
Over-reliance on single-chain data misses cross-chain arbitrage opportunities that drive temporary imbalances. Ignoring issuer redemption mechanics can lead to false positives when onchain supply changes do not reflect actual backing. Failing to account for seasonal market patterns may cause analysts to misinterpret routine volatility as structural risk. Another frequent error involves neglecting data latency across chains, which can delay alerts by several minutes during peak network congestion. Finally, analysts sometimes overlook the impact of regulatory announcements that indirectly affect stablecoin demand and flows.
Building Long-Term Resilience Through Onchain Practices
Integrating these monitoring techniques into daily workflows allows tokenomics researchers to move from reactive responses to proactive defense. Regular reviews of dashboard performance and alert accuracy ensure the system evolves with changing market dynamics. By documenting every detected signal and outcome, teams create valuable internal knowledge bases that improve future detection rates. In 2026, the combination of automated tooling and disciplined manual oversight remains the most reliable approach to safeguarding stablecoin positions against unexpected depegs.

No comments yet. Be the first!