 CryptoChain Blog

Stablecoin Redemption Queues 2026: Onchain Tokenomics Playbook
Stablecoin redemption queues have become essential onchain indicators for evaluating token sustainability, reserve health, and potential market stress in 2026. As stablecoins like USDT and USDC continue to underpin decentralized finance, understanding how redemption queues form and evolve provides analysts with actionable foresight into supply dynamics and peg resilience across multiple blockchains.
Understanding Redemption Queue Mechanics
Redemption queues occur when users submit requests to exchange stablecoins for underlying fiat reserves or collateral at the issuer level. These queues build when redemption volume outpaces immediate processing capacity, creating delays that influence holder behavior and overall token velocity. In tokenomics terms, prolonged queues can signal tightening liquidity conditions or heightened demand for off-ramping, which in turn affects circulating supply and cross-chain flows.
The mechanics differ slightly between issuers. Requests are typically batched and processed in order of submission, with onchain events logged on the respective blockchain. Queue length is measured by the number of outstanding redemption tickets or the total value awaiting fulfillment. When queues lengthen, they often correlate with reduced transaction velocity as holders anticipate delays or potential fees.
Key Metrics for Queue Analysis
Analysts track average queue wait time, total queued value, and the ratio of queued redemptions to daily burn volume. These metrics help quantify pressure on reserves. For instance, a sudden spike in queued value relative to recent averages can precede measurable changes in supply velocity on the same chain.
USDT and USDC Queue Dynamics Compared
USDT redemptions frequently concentrate on Ethereum and Tron, where Tether processes requests through centralized channels that feed into onchain burns. USDC queues, managed by Circle, appear prominently on Ethereum, Solana, and Polygon, with more transparent event logging that facilitates real-time tracking. The differences in processing speed and supported chains lead to distinct queue patterns during market stress.
USDT queues tend to show higher volatility on Tron due to lower fees and faster settlement, while USDC queues on Solana often reflect institutional flows. Comparing the two reveals how chain-specific factors influence queue formation and resolution times. Tether official site and Circle official resources provide issuer-level transparency reports that complement onchain queue data.
Real-Time Onchain Monitoring Workflows
Effective monitoring starts with establishing reliable data pipelines. Analysts begin by identifying the relevant smart contract addresses for mint and burn events on target chains. Next, they query historical and live events to calculate queue length by comparing initiated redemptions against completed burns.
A practical workflow includes these steps: first, set up API connections to blockchain indexers; second, aggregate daily redemption volumes and subtract processed amounts to derive queue size; third, calculate velocity using transfer counts and unique addresses; fourth, visualize correlations in dashboards to spot divergences early. Repeating this process daily or hourly during volatile periods allows for timely alerts.
Examples from 2026 show that teams monitoring multiple chains simultaneously caught queue buildups on Ethereum 24 to 48 hours before velocity dropped across connected networks. Custom scripts using libraries like Web3.py enable automated polling every 15 minutes, feeding results into visualization tools for quick interpretation.
Advanced Monitoring Techniques
Beyond basic queries, analysts layer in cohort filtering to separate retail from institutional redemptions. They also monitor gas price spikes that might delay queue processing and cross-reference with oracle price feeds to detect early depeg risks. This multi-layered approach improves signal accuracy.
Wallet Cohort Breakdowns and Examples
Breaking down redemptions by wallet cohorts provides deeper insight. Whale addresses holding over 1 million tokens often drive the largest queue segments during uncertainty, while retail wallets under 10,000 tokens contribute volume but shorter average waits. Exchange hot wallets form a third cohort with predictable patterns tied to trading activity.
In one 2026 example, a cluster of institutional wallets initiated a 45 million USDC queue on Ethereum that resolved over five days, coinciding with a temporary velocity slowdown. Retail cohorts on the same chain showed faster processing but higher frequency, illustrating how cohort size affects overall queue duration and sustainability signals.
Case Studies from 2026 Market Events
The March 2026 liquidity squeeze demonstrated clear queue-velocity linkages. USDC queues on Ethereum grew to record levels, with average wait times extending beyond 72 hours. Supply velocity fell 18 percent on the chain while Tron-based USDT queues remained stable, highlighting chain-specific resilience.
Another event in June 2026 involved a Tron USDT queue spike triggered by regional regulatory announcements. Queue length tripled within 48 hours, and analysts using velocity correlations correctly anticipated a short-term supply contraction. These cases underscore the value of combining queue metrics with onchain velocity data for predictive analysis.
A third case from September 2026 on Solana showed how rapid queue resolution on USDC prevented broader depeg events, thanks to proactive issuer communication and onchain transparency.
Correlation with Supply Velocity Across Chains
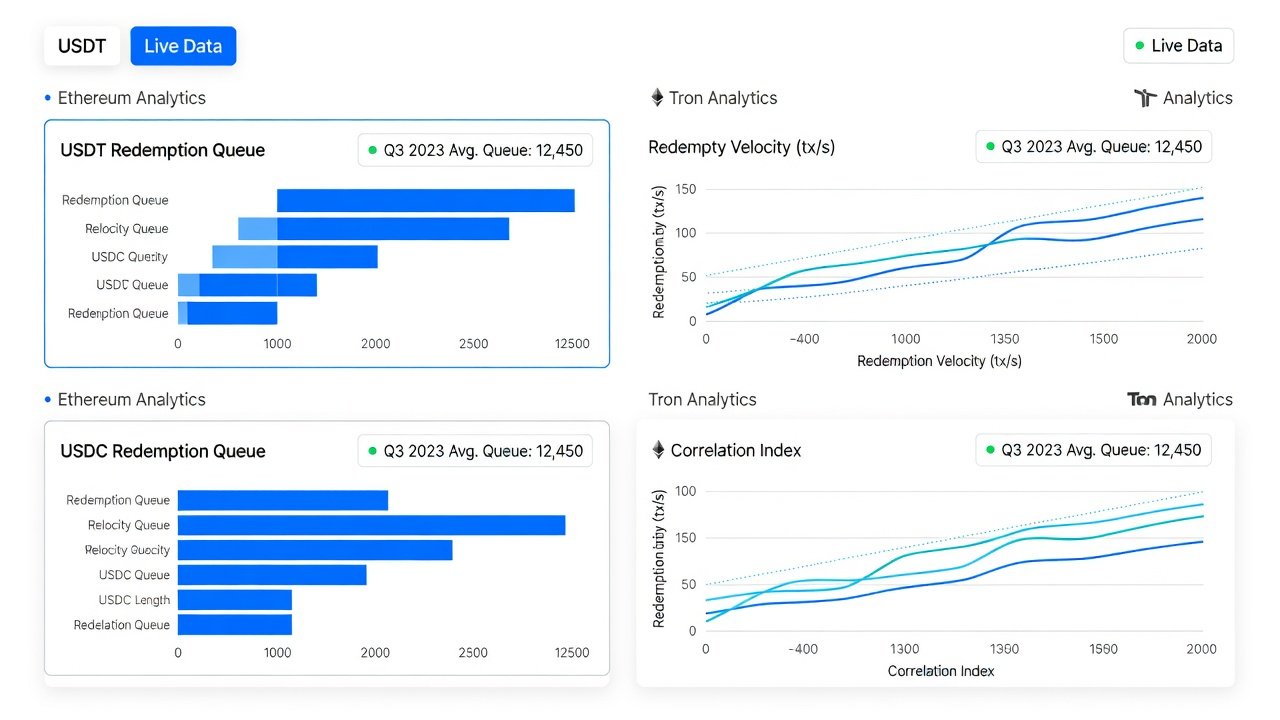
Supply velocity, measured as the frequency of token transfers relative to total supply, often declines as redemption queues lengthen. This correlation arises because queued tokens are effectively removed from active circulation until processed. Analysts calculate velocity using 7-day and 30-day windows to filter noise and identify sustained trends.
Cross-chain comparisons reveal that Ethereum queues impact velocity more broadly due to its role as a hub, while Tron and Solana show more localized effects. Tracking these correlations helps forecast reserve drawdowns and potential minting responses from issuers.
Practical Tools and Alert Setups
Recommended platforms include DeFiLlama for stablecoin overviews, Dune Analytics for custom query dashboards, and direct blockchain explorers for granular event data. Set alerts for queue length thresholds, such as when queued value exceeds 150 percent of the 7-day average, or when velocity drops below historical norms for the same period.
Integration examples involve connecting webhook services to send Slack or email notifications when predefined conditions trigger. Teams also combine these alerts with portfolio management systems to automate risk scoring and position adjustments. DeFiLlama serves as a starting point for baseline metrics, while advanced users extend queries on Dune Analytics for deeper cohort analysis.
Mistakes to Avoid When Interpreting Queue Signals
Common errors include ignoring chain-specific processing differences, overreacting to single-day spikes without velocity context, and failing to account for scheduled maintenance windows at issuers. Another pitfall is neglecting cross-chain arbitrage flows that can rapidly clear queues. Always validate queue data against multiple sources before drawing conclusions about sustainability risks.
FAQs on Interpreting Queue Signals
How do redemption queues affect peg stability?
Extended queues can indicate reserve strain and temporarily pressure pegs until processing volume increases or new mints restore equilibrium.
What queue length indicates sustainability risk?
Lengths consistently above 200 percent of recent averages, combined with velocity declines, typically warrant deeper investigation into reserve composition and issuer responses.
Which chains show the clearest queue data?
Ethereum and Tron currently offer the most transparent redemption event logs for both USDT and USDC, enabling precise queue length calculations.
Can queue signals predict minting activity?
Yes, sustained queue growth often precedes issuer minting to replenish reserves, providing an early signal for supply expansion phases.
How frequently should analysts review queue metrics?
Daily reviews suffice during calm periods, while hourly monitoring is recommended during high-volatility events or when queues approach critical thresholds.
Conclusion
Redemption queue analysis delivers practical, forward-looking insights into stablecoin tokenomics. By combining detailed onchain workflows, cohort breakdowns, velocity correlations, and real-world case studies, analysts can better assess sustainability risks and make informed decisions throughout 2026. Implementing robust monitoring and alert systems ensures these signals translate into actionable intelligence rather than reactive measures.
No comments yet. Be the first!