 CryptoChain Blog
Introduction to Stablecoin Redemption in 2026
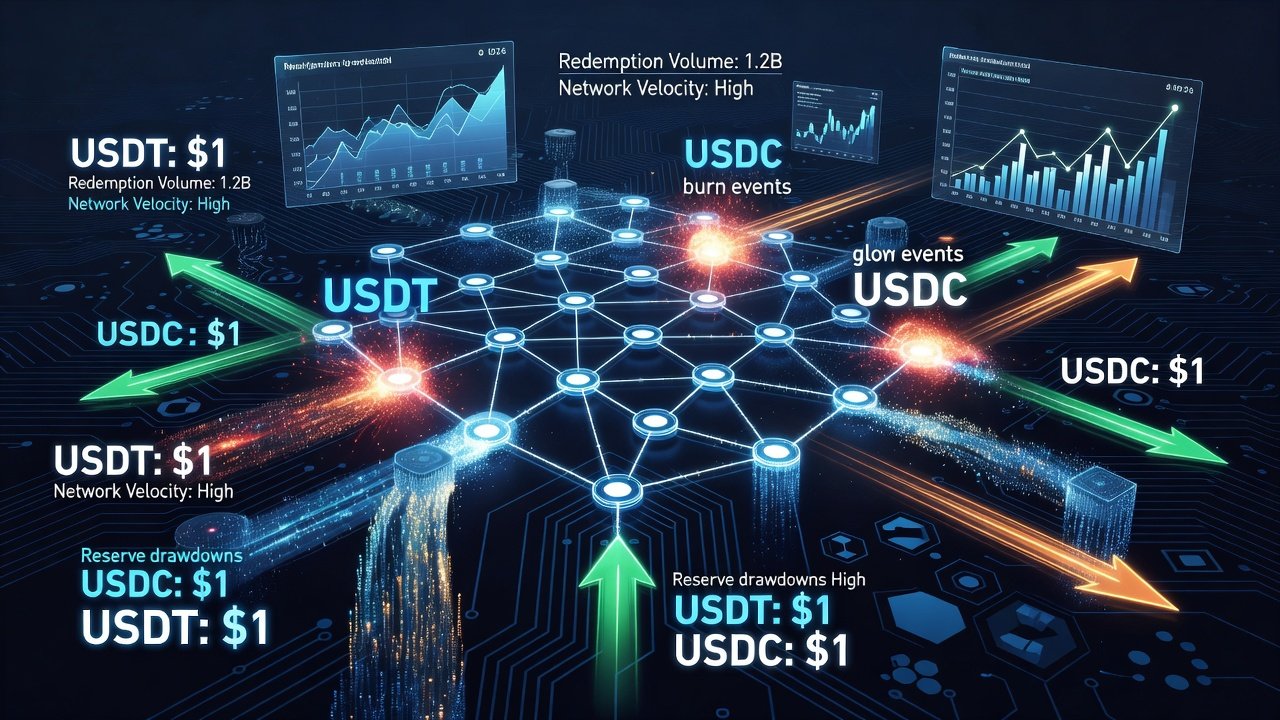
Stablecoin redemption patterns have become a critical lens for analysts evaluating tokenomics sustainability beyond simple supply metrics. In 2026, onchain data reveals how burn events and reserve drawdowns influence token velocity, liquidity, and issuer resilience during market stress. This playbook equips analysts with workflows to track redemptions across major issuers like Tether (USDT) and Circle (USDC), using blockchain analytics tools for actionable signals that go far deeper than headline circulation numbers.
Redemptions represent the precise moment when stablecoins exit circulation, often signaling shifts in institutional demand, retail confidence, or macroeconomic pressures. Understanding these mechanics helps forecast velocity changes and potential stress points in DeFi ecosystems. By examining real onchain footprints, analysts can identify early warning signs of liquidity crunches or healthy contraction phases that support long-term token viability.
Core Redemption Mechanics: Burns, Reserves, and Velocity
Redemption begins with a burn transaction onchain, where tokens are permanently removed from supply through smart contract interactions. For USDT and USDC, this onchain action pairs directly with offchain reserve adjustments managed by the issuer. A large burn event can indicate institutional withdrawals, arbitrage opportunities closing, or panic-driven exits, each carrying distinct implications for token velocity—the rate at which tokens circulate within the economy.
Reserve drawdowns occur when issuers liquidate underlying assets such as Treasuries or cash equivalents to fulfill redemption requests. Monitoring these drawdowns alongside onchain burns provides a fuller picture of sustainability. During recent volatility episodes in early 2026, spikes in burns correlated with temporary velocity increases as remaining holders transacted more actively to reposition portfolios. Velocity can be approximated by dividing total onchain transfer volume by the average circulating supply over a defined period, adjusted for redemption volume to isolate net effects.
Practical Examples from Market Stress Periods
Consider a March 2026 episode where USDC burns exceeded 2 billion tokens within 48 hours across Ethereum and Base. Onchain records showed concentrated activity from institutional wallets, followed by a 15% velocity uptick in the subsequent week as liquidity providers adjusted positions. Similar patterns in USDT revealed heavier Tron-based redemptions, highlighting chain-specific behaviors that basic supply dashboards miss.
Step-by-Step Workflow for Tracking Redemptions Across Issuers
Follow this expanded process to monitor USDT and USDC redemptions systematically:
- Connect to primary blockchain explorers such as Etherscan for Ethereum-based flows and equivalent tools on Tron, Solana, and Base.
- Query known burn addresses specific to each issuer, applying filters for transaction value thresholds above $1 million to focus on material events.
- Cross-reference burn timestamps with reserve reports published on official issuer dashboards to confirm offchain backing changes.
- Aggregate multi-chain data using analytics platforms to calculate adjusted velocity ratios that account for redemption outflows.
- Log event timestamps and wallet labels to correlate with broader market events like interest rate announcements or regulatory news.
- Export datasets for cohort segmentation and trend visualization in external analysis software.
This workflow surfaces patterns invisible in aggregate supply charts alone and supports repeatable daily or weekly reviews.
Wallet Cohort Analysis for Redemption Signals
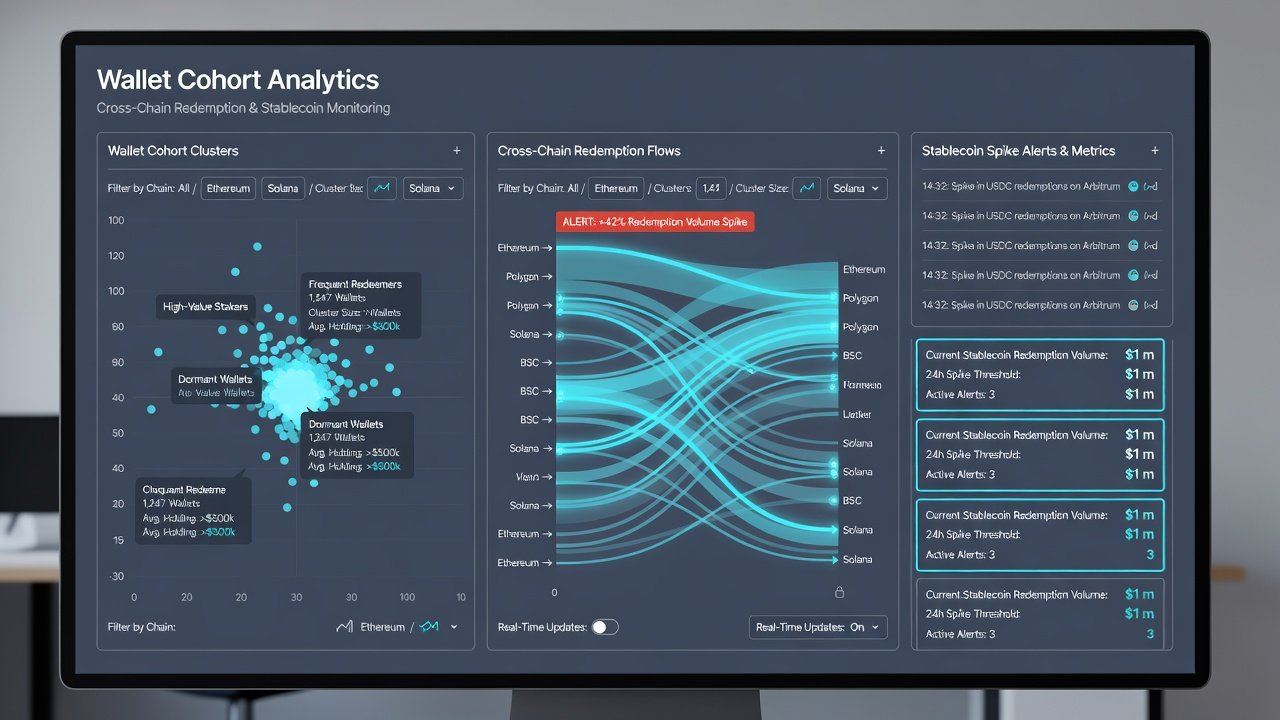
Segmenting wallets by size, age, and behavior reveals who drives redemptions and why. Large holders (whales holding over 10 million tokens) often initiate bulk burns during stress periods, while retail cohorts exhibit steadier but smaller-volume activity. In 2026 datasets from volatility spikes, whale redemptions preceded liquidity squeezes by 24-48 hours in multiple documented cases across both USDT and USDC.
Advanced tools allow clustering wallets by historical redemption frequency and cross-chain migration patterns. Analysts track cohort migration between networks to predict concentrated outflows that could pressure specific liquidity pools. For instance, a shift of large USDT cohorts from Ethereum to Tron during fee spikes often signals cost-sensitive redemptions rather than loss of confidence.
Cross-Chain Redemption Flows and Liquidity Impacts
Redemptions increasingly span multiple chains, with bridges facilitating moves from Ethereum to faster, lower-cost networks like Solana or Base. Recent market stress in 2026 showed USDT redemptions flowing heavily toward Tron for reduced transaction costs, which in turn impacted base-layer liquidity pools on Ethereum by draining available depth.
These cross-chain flows can create temporary imbalances, raising slippage for remaining users and altering velocity calculations. Real examples from mid-2026 volatility demonstrated how coordinated cross-chain redemptions amplified velocity spikes before equilibrium returned within 72 hours. Liquidity impacts extend to DeFi protocols where stablecoin pairs serve as collateral; sudden redemptions can force liquidations if collateral ratios drop below thresholds.
Practical Alerts for Unusual Redemption Spikes
Build robust monitoring systems with these detailed steps:
- Set dynamic thresholds on burn volume exceeding 5% of the 30-day daily average, calibrated separately per chain.
- Integrate webhook notifications from analytics APIs for real-time alerts tied to both burn events and reserve ratio changes.
- Combine alerts with reserve ratio trackers to flag potential drawdowns before they affect secondary market pricing.
- Backtest alert configurations against historical stress periods from 2025 and 2026 to refine false positive rates.
- Incorporate sentiment overlays from onchain labeled entities such as exchanges or market makers for contextual prioritization.
Such systems deliver early warnings beyond basic supply metrics and can be automated via scripts querying public blockchain nodes.
Comparing Issuer Transparency: USDT vs USDC
Circle publishes frequent attestations via Circle, offering detailed reserve breakdowns updated monthly with third-party verification. Tether provides monthly reports through Tether but with less granular real-time data access. Analysts routinely favor platforms like Etherscan and DeFiLlama for independent onchain verification to bridge transparency gaps between issuers.
USDC generally scores higher on audit frequency and detail level, while USDT leads in multi-chain volume and historical redemption throughput. Both require ongoing onchain cross-checks for complete tokenomics assessment, particularly when evaluating sustainability under varying regulatory environments projected for late 2026.
Conclusion
Mastering stablecoin redemption patterns in 2026 demands integrating onchain burns, wallet cohort behaviors, cross-chain dynamics, and issuer transparency metrics. By implementing the workflows, alert systems, and analytical frameworks outlined, analysts gain precise, decision-useful signals for token velocity and sustainability that static metrics overlook. Continuous monitoring and iterative refinement of these techniques position professionals ahead of liquidity shifts and evolving issuer developments across the stablecoin landscape.


No comments yet. Be the first!