 CryptoChain Blog
Introduction to On-Chain Analytics for Solana and AVAX
Solana and Avalanche (AVAX) continue to stand out as premier Layer 1 blockchains in 2026, each offering distinct advantages in speed, scalability, and ecosystem growth. Solana emphasizes high-throughput transactions while Avalanche focuses on customizable subnets and rapid finality. For crypto investors prioritizing data-driven decisions, understanding on-chain metrics such as transactions per second (TPS), total value locked (TVL) trends, and validator activity is essential. These metrics reveal network health, user adoption, and potential market movements far better than surface-level price charts.
This comprehensive guide explores the eight leading analytics platforms tailored for Solana and AVAX. It provides direct comparisons, detailed setup instructions, real-world examples of identifying shifts, and a complete FAQ addressing accuracy and costs. The focus remains on practical evaluation methods that support thorough altcoin research rather than trading signals.
Comparing the Top 8 Analytics Tools for Solana and AVAX
Selecting the right platform depends on the specific metrics you need. DefiLlama stands out for TVL visualization across both networks, offering breakdowns by protocol and chain. Dune Analytics enables custom SQL queries to compare TPS and validator distributions. Solscan delivers native Solana data including real-time TPS and account activity. Avascan provides Avalanche-specific insights into validator performance and subnet metrics.
Artemis aggregates cross-chain user and activity data, making it useful for benchmarking Solana against AVAX. Flipside Crypto supports community queries focused on token flows and smart contract interactions. Nansen adds wallet intelligence through labeling and smart money tracking. Token Terminal emphasizes protocol revenue and fundamental indicators. In side-by-side use, DefiLlama and Dune together cover most TVL and TPS needs, while Solscan and Avascan handle chain-native validator monitoring with greater precision.
Detailed Step-by-Step Setup Guides
Begin with DefiLlama by navigating to the homepage and applying Solana or Avalanche filters. Create saved views for TVL trends over 30-day and 90-day periods, then enable email notifications for significant changes. Dune Analytics requires a free account registration followed by forking public Solana TPS dashboards. Customize queries to include AVAX validator counts and schedule weekly exports.
For Solscan, no account is needed for basic explorer views, but generating an API key allows automated pulls of TPS and staking data. Avascan setup starts with selecting the primary C-Chain view, then configuring alerts for validator uptime drops below 95 percent. Artemis involves connecting a wallet for personalized cross-chain dashboards. Flipside users build queries around Solana DeFi volumes and AVAX bridge activity. Nansen setup includes labeling known wallets for ongoing smart money flow monitoring. Token Terminal requires selecting individual protocols on each chain and saving revenue trend charts.
Each platform offers mobile-friendly interfaces, though desktop use provides the clearest metric overlays. Test setups during low-volatility periods to ensure alerts function correctly before relying on them for live research.
Real-World Examples of Spotting Market Shifts
During Q1 2026, Dune Analytics users detected an unusual TPS spike on Solana linked to a popular NFT launch. By cross-referencing with Solscan validator load data, analysts anticipated temporary fee increases and adjusted positions accordingly. On Avalanche, Avascan revealed a steady rise in active validators ahead of a major subnet governance proposal, which preceded a measurable TVL increase across multiple DeFi protocols.
Another case involved Flipside Crypto queries showing concentrated token flows from labeled smart money wallets into AVAX ecosystem projects. Investors who monitored these patterns early identified emerging opportunities before broader market awareness. Combining Artemis user activity metrics with DefiLlama TVL charts helped confirm whether Solana growth was driven by genuine adoption or temporary hype cycles.
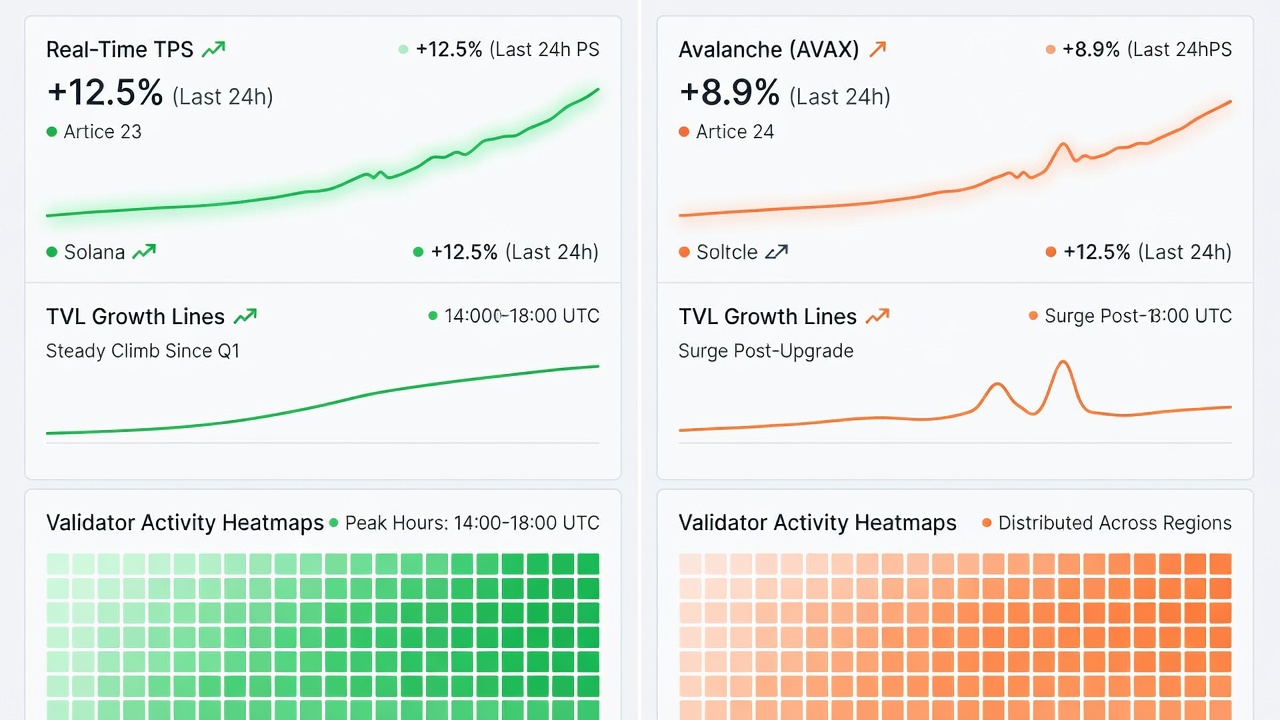
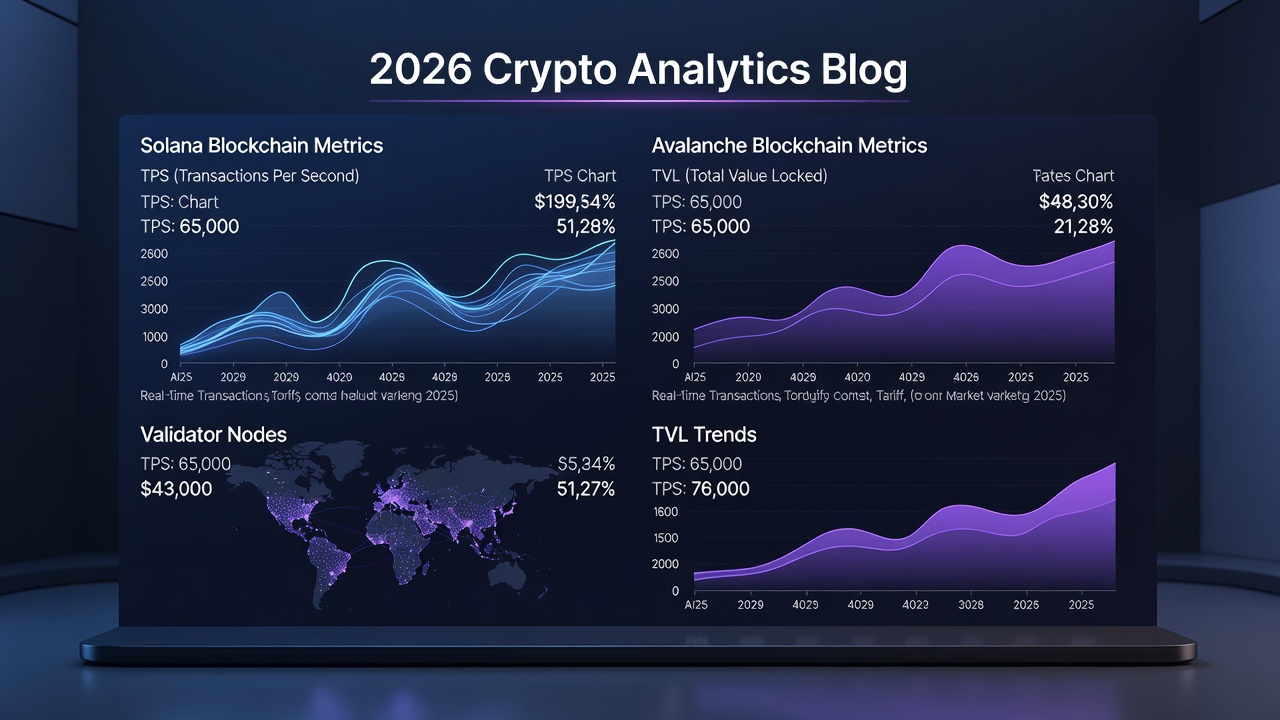
Understanding Key Metrics: TPS, TVL, and Validator Activity
TPS measures network throughput and indicates congestion risks during peak usage. Consistent high TPS on Solana often signals strong application demand, while fluctuations on AVAX may reflect subnet-specific activity. TVL trends reveal capital inflows and protocol health; sudden drops can precede broader sentiment shifts. Validator metrics track decentralization and security, with uptime and stake distribution serving as leading indicators of network stability.
Practical evaluation involves comparing these metrics week-over-week rather than relying on absolute numbers. For instance, a 20 percent TVL increase paired with stable validator counts suggests sustainable growth on either chain.
Expanded FAQ on Data Accuracy and Tool Costs
- How accurate are the metrics across platforms? Most aggregate directly from public blockchain data with minimal processing delay, though minor discrepancies can occur due to indexing differences.
- Do any tools require payment for core features? Basic dashboards and historical data remain freely accessible on all eight platforms, while advanced exports and custom alerts may involve optional subscriptions.
- Can users export data for personal models? Yes, API access on Dune, Flipside, and Nansen supports CSV and JSON exports suitable for external analysis.
- How frequently is data updated? Real-time updates occur on explorers like Solscan and Avascan, while aggregated platforms refresh every few minutes.
- Are historical datasets reliable for backtesting? Yes, most platforms maintain multi-year records suitable for trend analysis.
Integrating Tools into a 2026 Altcoin Research Workflow
Establish a repeatable process beginning each Monday with DefiLlama TVL baselines for both chains. Follow with Dune queries targeting TPS anomalies and validator participation rates. Cross-check findings using Solscan for Solana and Avascan for AVAX before reviewing wallet flows on Nansen. Incorporate official resources such as Solana and Avalanche documentation to contextualize technical upgrades. Rotate between Artemis and Token Terminal for revenue and user metrics to avoid single-source bias. Document observations weekly in a shared spreadsheet to track patterns over time.
Common Mistakes to Avoid When Using Analytics Tools
Overlooking data lag during high network activity can lead to incomplete pictures. Relying solely on TVL without validator context often misrepresents decentralization risks. Ignoring subnet-specific metrics on Avalanche misses nuanced activity signals. Always verify anomalies across at least two platforms before drawing conclusions.
Conclusion and Actionable Next Steps
Mastering these eight analytics platforms equips investors with precise evaluation capabilities for Solana and AVAX performance throughout 2026. Begin by configuring dashboards on DefiLlama and Dune today, then monitor TPS and TVL daily for one week. Expand to validator tracking on native explorers and refine your workflow based on observed patterns. Consistent use transforms raw data into actionable research insights.

No comments yet. Be the first!