 CryptoChain Blog
Introduction to Token Velocity in 2026 Crypto Markets
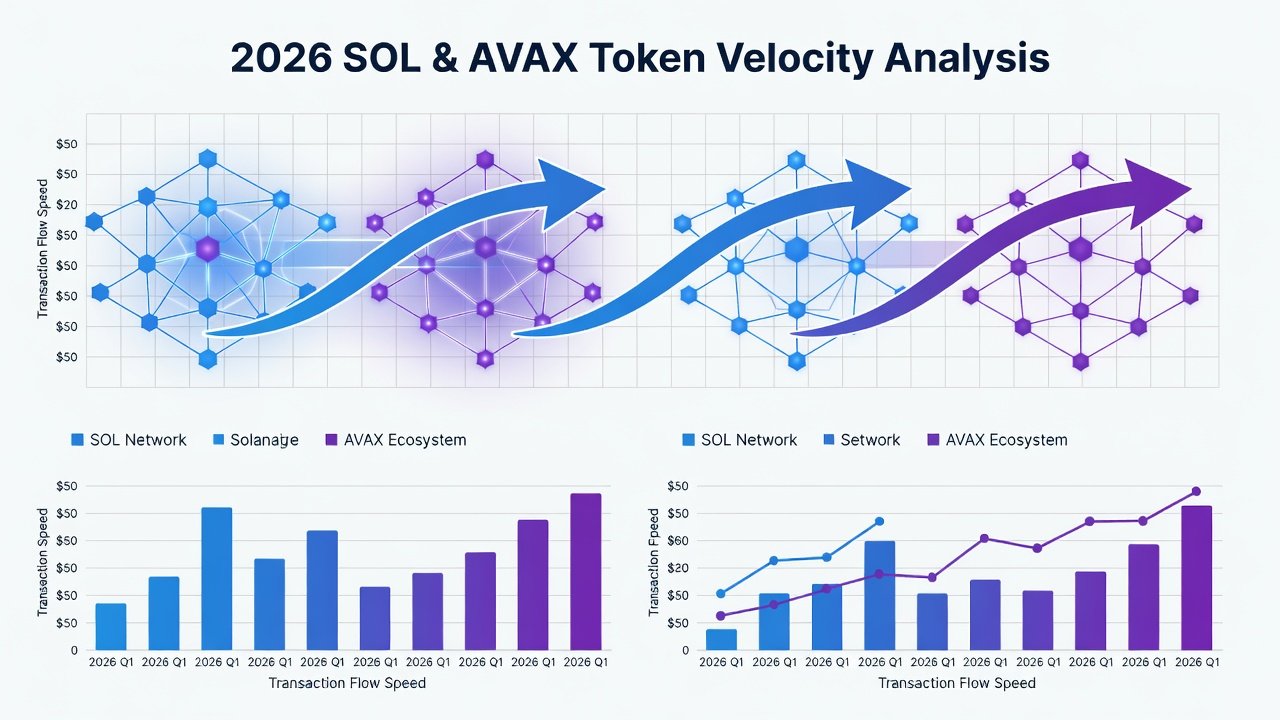
Token velocity measures how quickly a cryptocurrency changes hands within its ecosystem. For SOL and AVAX, understanding velocity helps investors assess whether high activity supports sustainable holder value or erodes it through rapid circulation. This analysis builds on supply and staking fundamentals to explore 2026 dynamics across both networks. Velocity is calculated by dividing total transaction volume by the average circulating supply over a period, providing a ratio that reveals usage intensity. In fast-moving chains like Solana and Avalanche, this metric becomes essential for distinguishing between speculative trading and genuine utility-driven activity. High velocity often signals strong usage but can pressure prices if new supply outpaces demand. Low velocity may indicate holding behavior that supports appreciation. In 2026, both Solana and Avalanche continue to evolve their tokenomics amid growing DeFi and network activity, with velocity serving as a forward-looking indicator for portfolio resilience.
Transaction Volume Trends for SOL and AVAX
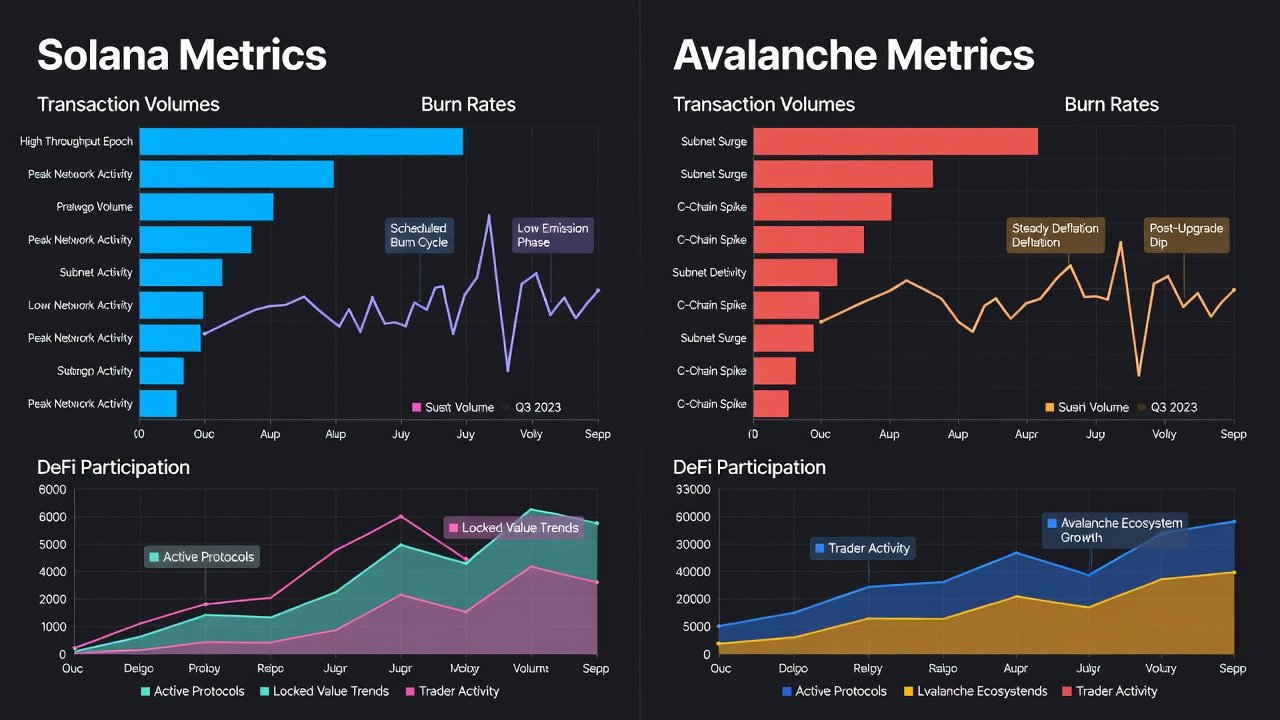
Transaction volumes on Solana have historically outpaced many chains due to its high throughput and low fees, enabling millions of daily operations in decentralized applications. Avalanche maintains competitive volumes through its subnets and C-Chain activity, particularly in gaming and institutional subnets that batch transactions efficiently. Monitoring daily active addresses and average transaction values reveals velocity signals. For instance, sustained growth in unique users correlates with controlled velocity when paired with staking rewards that lock tokens for extended periods. Real-world examples include decentralized exchanges processing millions of trades monthly, which accelerates token movement but also generates fees that can influence circulation speed. Trends in 2026 show Solana benefiting from meme coin and NFT ecosystems that spike short-term volume, while Avalanche sees steadier growth from cross-chain bridges and enterprise pilots. Investors should track these patterns using public explorers to identify when volume growth translates into holder value rather than pure speculation.
Burn Mechanisms and Their Impact on Circulation Speed
Both networks incorporate fee-burning elements that reduce circulating supply over time. On Solana, a portion of transaction fees is burned, potentially lowering velocity if demand for block space remains high and creates consistent deflationary effects. Avalanche uses similar mechanisms through its dynamic fee structure, where base fees and tips contribute to burns that counteract rapid token flows. These burns create deflationary pressure that can offset high-velocity environments by making each remaining token more scarce. Investors tracking burn rates alongside volume data gain insight into net supply changes affecting long-term value. In practice, periods of network congestion amplify burns, which historically have helped stabilize prices during usage surges. Examining cumulative burn totals over quarters provides a clearer picture of how these mechanisms interact with velocity to preserve holder purchasing power.
DeFi Participation Rates and Velocity Effects
DeFi protocols on both chains drive significant token velocity through lending, liquidity provision, and yield farming. Higher participation often increases circulation as users move assets between protocols for optimal returns. Examples from top protocols include perpetual futures platforms that require frequent collateral adjustments and automated market makers that facilitate thousands of swaps daily, each contributing to token turnover. On Solana, popular lending markets and liquidity pools see rapid asset rotation during bull phases, while Avalanche's subnets enable customized DeFi environments with potentially lower velocity due to specialized use cases. Strategies for monitoring include reviewing total value locked trends and protocol-specific velocity multipliers. Participation rates above certain thresholds can signal maturing ecosystems where velocity supports rather than undermines value, especially when combined with revenue-sharing models that reward long-term holders.
Side-by-Side Metric Comparisons
Key metrics for comparison include average daily transactions, staking ratios, and velocity ratios calculated as on-chain volume divided by market capitalization. Solana typically shows higher throughput, impacting velocity positively for payments use cases, whereas Avalanche emphasizes subnet flexibility affecting localized velocity in niche applications. Additional factors such as average transaction size and fee distribution further differentiate the two. Solana's emphasis on parallel processing allows for burst activity without proportional velocity spikes when fees remain minimal. Avalanche's proof-of-stake variant and validator rewards encourage longer holding periods that dampen overall circulation speed. Practical comparisons involve reviewing quarterly reports to spot divergences, such as when one chain's DeFi TVL growth outpaces the other's without corresponding velocity increases.
- Transaction speed: Solana leads in raw TPS, impacting velocity positively for payments use cases.
- Staking influence: Both chains reward stakers, which can reduce available supply and moderate velocity.
- DeFi TVL share: Allocation between lending and trading protocols reveals where velocity concentrates.
- Bridge activity: Cross-chain inflows often temporarily elevate velocity before tokens settle into staking or liquidity positions.
Actionable Strategies for Investors
To monitor velocity signals, use on-chain analytics dashboards for real-time volume and burn data. Set alerts for spikes in transaction counts that exceed historical averages by more than 50 percent. Compare velocity ratios quarterly against network growth metrics and staking participation percentages. Practical steps include diversifying across both ecosystems to hedge against chain-specific velocity shocks, tracking governance proposals that alter fee structures or introduce new burn parameters, and reviewing quarterly network reports from official sources. Another tactic involves calculating personal portfolio velocity exposure by weighting holdings according to each chain's ecosystem turnover rates. Tools such as public block explorers and aggregated data platforms allow investors to build custom dashboards that flag when high velocity coincides with declining holder retention, prompting timely rebalancing decisions.
FAQs on Interpreting Velocity Data
How does high velocity affect portfolio decisions?
High velocity may indicate strong utility but signals potential price pressure from constant selling pressure. Balance with staking yields and burn data before adjusting holdings, and consider reallocating toward lower-velocity assets during prolonged high-turnover periods.
What risks come with high-velocity environments?
Rapid circulation can amplify volatility during market stress and increase susceptibility to flash crashes or liquidity drains. Investors should watch for decoupling between volume growth and holder retention rates, which often precedes corrections.
Can velocity be used to predict price movements?
Velocity serves as a leading indicator when combined with supply metrics, but it is not foolproof. Sustained rises without corresponding demand growth frequently precede value erosion, making it a useful but supplementary signal.
How do staking rewards interact with velocity?
Staking locks tokens and reduces effective circulating supply, thereby lowering observed velocity and supporting price stability. Monitoring unstaking trends provides early warnings of potential velocity increases.
2026 Forecasts and Tracking Tools
Analysts project continued maturation of both networks, with velocity stabilizing as DeFi matures and institutional adoption introduces more predictable flows. Recommended tools include official explorers and data aggregators for ongoing analysis of volume, burns, and participation. Regular review of these metrics enables proactive adjustments rather than reactive responses to market shifts.
Visit Solana's official site and Avalanche's official site for latest network metrics. Additional resources at DeFiLlama support velocity tracking across protocols.
Conclusion
Token velocity remains a critical lens for evaluating SOL and AVAX holder value in 2026. By integrating volume trends, burn impacts, and DeFi rates into analysis, investors can make informed decisions in evolving markets. Consistent monitoring and diversified strategies position portfolios to benefit from utility growth while mitigating risks associated with excessive circulation speeds.
No comments yet. Be the first!