 CryptoChain Blog
SOL vs AVAX 2026: How Inflation Shapes DeFi Yields
Inflation mechanics in layer-1 blockchains directly influence staking rewards, token supply dynamics, and ultimately the net yields available in decentralized finance protocols. For advanced users evaluating Solana (SOL) and Avalanche (AVAX) in 2026, understanding these schedules is essential for optimizing positions across lending markets, automated market makers, and yield farms. Token inflation acts as a continuous supply pressure that can dilute returns unless offset by protocol fees, burns, or additional incentive layers. This analysis examines how scheduled emission reductions, burn mechanisms, and network activity interact with DeFi strategies to shape realistic net APYs throughout 2026.
Advanced altcoin participants often overlook the compounding interaction between base-layer inflation and application-layer rewards. In practice, a protocol offering 12 percent gross yield on Solana may deliver materially different net results than an equivalent strategy on Avalanche once inflation drag and burn offsets are modeled. The following sections provide granular breakdowns supported by protocol mechanics and holding-period calculations.
Solana Inflation Schedule and Emission Dynamics
Solana employs a disinflationary model with scheduled reductions in the annual inflation rate. This structure gradually lowers the rate at which new SOL enters circulation, balancing validator incentives with long-term scarcity. The approach affects base staking yields while interacting with protocol-level emissions in DeFi applications. Current trajectory points toward continued annual step-downs that reduce the inflation rate by approximately 15 percent each year until reaching a long-term floor. Validator rewards remain the primary destination for new issuance, yet priority fee burns increasingly counteract supply growth during periods of elevated network demand.
Burn mechanisms, driven by priority fees and transaction activity, provide a counterbalance by removing tokens from supply. Higher network usage can therefore offset inflationary pressure, creating a more favorable environment for yield-seeking strategies. In 2026, users monitoring daily burn volumes relative to issuance can identify windows when net supply growth turns negative, boosting the real yield of SOL-denominated positions across lending and liquidity protocols.
Avalanche Inflation Schedule and Emission Dynamics
Avalanche maintains its own inflationary framework centered on the AVAX token, with emissions primarily directed toward validator rewards and subnet incentives. The schedule features periodic adjustments that influence overall supply growth and the attractiveness of staking versus DeFi participation. Unlike Solana’s predictable step-down path, Avalanche emissions can fluctuate with subnet launch activity and validator set size, introducing additional variability into yield forecasts.
Unlike purely fee-burn models, Avalanche incorporates variable emission rates tied to network participation. This creates different yield sensitivities compared to Solana, particularly when subnets expand or contract activity levels. Subnet-specific rewards can amplify or dampen the base inflation effect, requiring users to track both primary chain metrics and individual subnet performance when constructing cross-chain yield strategies.
Direct Effects on 2026 DeFi Yields
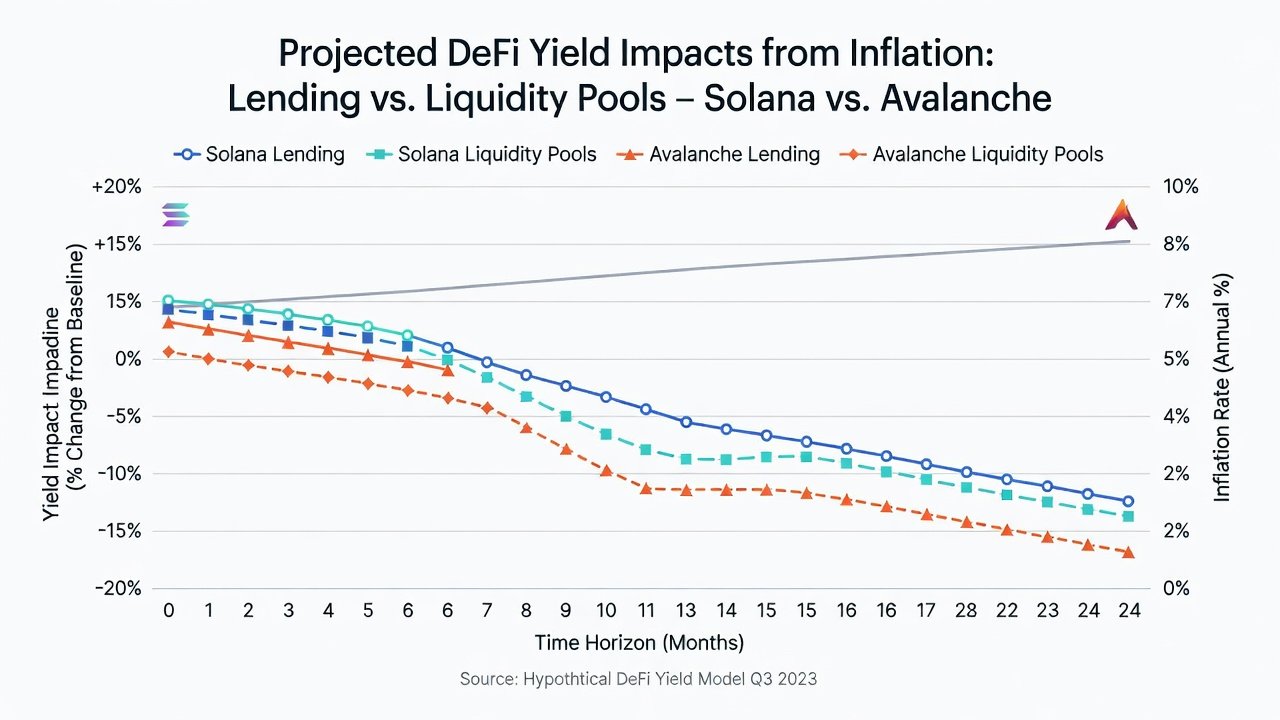
Inflation impacts DeFi yields through opportunity cost and reward dilution. In lending protocols, higher base inflation can compress net APYs unless offset by utilization fees or additional incentives. Liquidity pools experience similar pressures when token emissions must compete with inflationary staking returns. Yield farms on both chains often layer native emissions on top of base inflation. The net result depends on how efficiently protocols recycle fees and burns to maintain competitive rates across different risk profiles.
Users who hold positions for multiple quarters must model cumulative inflation drag against fee accrual. Short-term traders may ignore modest inflation differentials, but longer-horizon strategies benefit from explicit adjustment of quoted APYs by the prorated inflation rate for each chain.
Protocol Examples: Kamino and Trader Joe
Kamino Finance on Solana integrates lending with automated liquidity strategies. Its yield calculations incorporate SOL inflation adjustments alongside concentrated liquidity fees, allowing users to model net returns after accounting for emission decay. Kamino’s automated vaults dynamically rebalance to capture priority fee revenue, which partially mitigates SOL inflation for liquidity providers.
Trader Joe on Avalanche provides similar functionality through its liquidity book and lending markets. AVAX inflation influences the baseline rewards, with the protocol adjusting farm incentives to remain attractive relative to native staking. Trader Joe’s veToken model further modulates emissions based on lock duration, giving long-term participants a tool to offset inflationary dilution more effectively than short-term farmers.
Comparative Analysis of Inflation Models
Side-by-side evaluation reveals that Solana’s more predictable disinflation path offers clearer forward guidance for yield modeling, while Avalanche’s subnet-driven variability rewards active monitoring. Both chains demonstrate that periods of high transaction volume can materially reduce net inflation, yet the magnitude differs due to distinct fee-burn designs. Advanced users therefore maintain separate yield dashboards for each ecosystem rather than applying a single cross-chain framework.
Practical Steps for Yield Optimization
Optimizing returns requires systematic evaluation of inflation-adjusted metrics. Begin by pulling current on-chain issuance and burn data, then layer protocol-specific incentives on top. Next, simulate holding periods of 30, 90, and 180 days to observe how inflation compounds. Finally, stress-test scenarios that include 20 percent utilization drops or 30 percent fee revenue declines to understand downside exposure.
- Calculate gross APY from lending or farming rewards using real-time protocol dashboards.
- Estimate annual inflation rate impact prorated to the holding period using the latest schedule parameters.
- Adjust for any burn offsets or fee revenue share captured during the period.
- Factor in risk premiums such as smart contract exposure or impermanent loss using historical volatility data.
- Compare resulting net yield against alternative staking returns on the same chain.
- Rebalance allocations quarterly or after major subnet or validator-set changes.
Common Mistakes to Avoid
- Ignoring cumulative inflation over multi-quarter horizons, which silently erodes apparent high APYs.
- Over-allocating to single-chain farms without stress-testing burn rate sensitivity.
- Neglecting subnet-specific emission changes on Avalanche that can suddenly alter relative attractiveness.
- Failing to update models after major network upgrades that modify fee-burn mechanics.
Step-by-Step Net Return Calculations
Users can estimate net returns by first determining gross yield from protocol incentives, then subtracting the effective inflation drag based on holding period. For short-term positions (under 90 days), fee generation typically dominates. For longer horizons, cumulative inflation becomes material. Different risk levels alter these outcomes. Conservative lending positions may show smaller but more stable net yields, while aggressive yield farms require higher gross returns to compensate for both inflation and volatility.
Adjusting Strategies Mid-Year
Market conditions and network activity can shift inflation effects rapidly. Monitoring on-chain metrics such as active addresses and fee burns helps identify when to reallocate between chains or protocols. When Solana burn volumes exceed issuance for consecutive weeks, liquidity strategies on Kamino often outperform static staking; the reverse scenario favors Avalanche positions where subnet incentives remain elevated.
FAQ
How often should investors recalculate net yields?
Quarterly reviews aligned with inflation schedule updates provide a practical cadence for most advanced users, with additional checks triggered by major protocol upgrades or subnet launches.
Does higher network activity always improve net returns?
Not necessarily. While burns reduce supply pressure, increased competition for yields can offset gains depending on protocol design and overall market participation levels.
What holding period minimizes inflation impact?
Shorter durations generally reduce cumulative inflation effects, though they may limit compounding opportunities in yield farms and require more frequent rebalancing.
Should users prefer one chain over the other for all 2026 strategies?
Chain preference depends on individual risk tolerance, preferred holding period, and ability to monitor subnet versus priority-fee dynamics; diversified allocations across both ecosystems often deliver more stable inflation-adjusted outcomes.
For deeper tokenomics research, refer to official resources at Solana and Avalanche. Protocol-specific documentation is available via Kamino Finance and Trader Joe.

No comments yet. Be the first!