 CryptoChain Blog

Introduction: Why a Structured Daily BTC Workflow Matters in 2026
Traders operating in the 2026 Bitcoin market face an overwhelming volume of information each day. Price movements, regulatory announcements, institutional activity, and protocol upgrades all compete for attention. Without a repeatable process, it becomes easy to react emotionally or miss subtle signals that on-chain data can reveal. This guide delivers a practical daily routine that integrates curated Bitcoin news with essential on-chain metrics to generate actionable insights. The emphasis remains on workflow efficiency rather than speculative price predictions.
A disciplined approach divides the trading day into distinct phases: morning news scanning with strict filters, midday review of three core on-chain dashboards, correlation analysis against price action, and an evening reflection template. By following these steps consistently, traders develop pattern recognition that improves decision quality over weeks and months. Real 2026 market behavior has shown that traders who maintain such routines identify accumulation phases earlier and avoid unnecessary exposure during distribution periods.
Morning News Scanning Filters
The trading day begins with a focused news scan lasting no more than 45 minutes. The goal is to separate high-signal developments from noise. Prioritize three primary categories: regulatory updates from government bodies, institutional capital flows such as ETF activity or corporate treasury decisions, and Bitcoin protocol or infrastructure changes including soft forks or mining pool announcements.
Implement keyword-based alerts for terms including ETF inflows, hash rate adjustments, Taproot usage growth, and custody regulation. Begin with primary sources before moving to secondary commentary. Cross-reference any headline against official channels to confirm accuracy and context. For example, a single regulatory clarification can shift long-term holder behavior within hours, which later appears in on-chain metrics.
Practical tips include setting up dedicated browser tabs or RSS readers limited to trusted domains and disabling push notifications during the scan. This prevents distraction and keeps the focus on relevance. In early 2026, traders who filtered out macro noise and concentrated on custody rule updates correctly anticipated subsequent rises in active address counts.
- Review official Bitcoin development channels first, including bitcoin.org announcements.
- Check institutional flow reports from established financial data providers.
- Limit total reading time and record only items that directly affect on-chain activity.
Three Essential On-Chain Dashboards
Following the news scan, allocate 30 minutes to three targeted on-chain dashboards. These provide quantitative context that news headlines alone cannot supply. The dashboards focus on network participation, miner behavior, and exchange dynamics.
- Active Addresses and Transaction Volume – Compare daily active addresses and transaction counts against seven-day and 30-day averages. Rising active addresses during stable price periods often indicate growing network usage.
- Hash Rate and Miner Metrics – Track hash rate trends alongside miner reserve balances and pool distribution. Sustained hash rate increases combined with declining miner selling pressure frequently precede positive price momentum.
- Exchange Net Flows – Monitor inflows versus outflows across major platforms. Persistent net outflows suggest accumulation by long-term holders, while sudden inflows during rallies may indicate distribution.
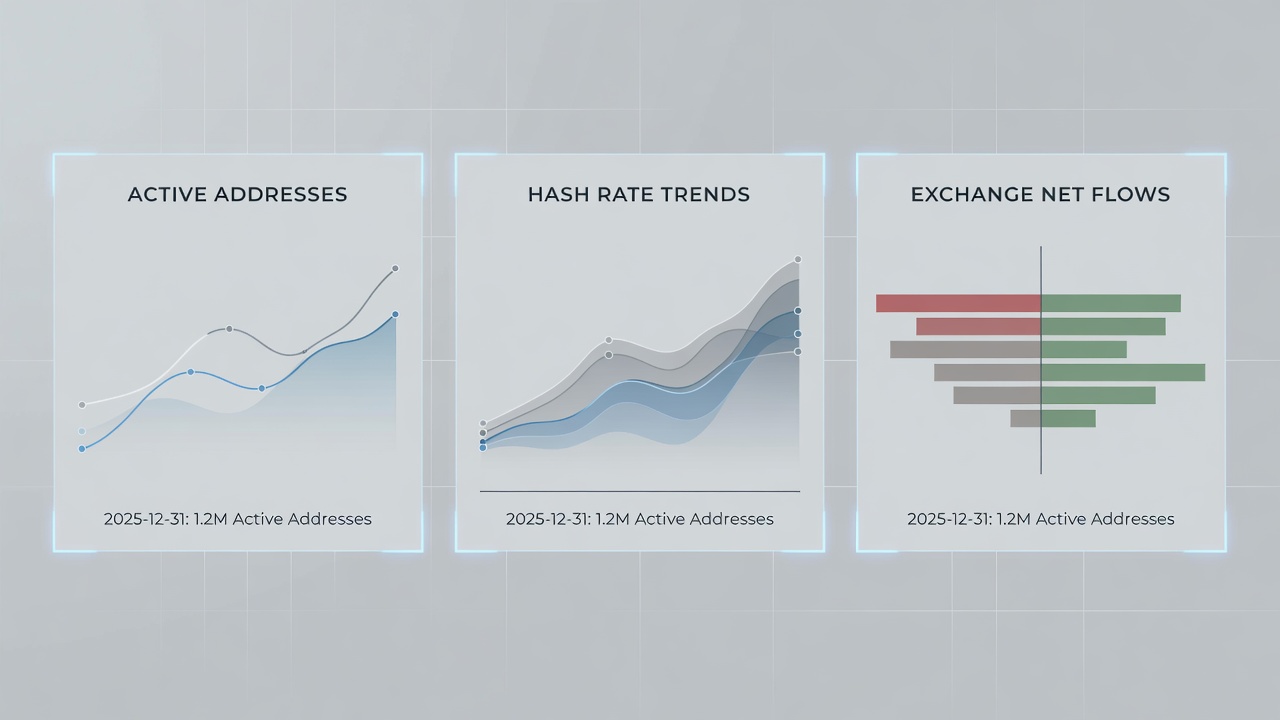
Traders should note divergences, such as increasing transaction volume without corresponding price movement, which can signal building pressure. In mid-2026 examples, hash rate climbed steadily for several weeks while exchange outflows remained elevated, eventually aligning with a breakout in price. Access these dashboards through established explorers including mempool.space for real-time visibility.
Correlation Checks with Price Action
After reviewing dashboards, perform correlation checks against recent price behavior on multiple timeframes. The objective is to identify confirmation or meaningful divergence rather than to predict exact moves. Overlay on-chain deltas on four-hour and daily charts to spot alignment.
Key scenarios to monitor include strong exchange outflows paired with price consolidation, which historically precedes upward continuation, and rising inflows during upward price action, which can warn of potential selling pressure. Record any metric that breaks its recent range and compare it to the prior day’s close.
Real 2026 market examples demonstrate the value of this step. In February, hash rate growth continued while price traded sideways. Within four trading sessions, price advanced sharply in alignment with sustained miner accumulation visible on-chain. Another instance involved rising active addresses coinciding with reduced exchange inflows, confirming underlying demand strength before the next leg higher. Use resources such as blockchain.com for additional flow visualizations during these checks.
Evening Review Templates
Conclude the day with a 20-minute structured review. Maintain a simple template that captures three news items reviewed, three on-chain observations, and one correlation note. Include whether the day’s insights aligned with observed price movement and any adjustments planned for the following session.
This habit compounds over time. Traders who complete the template daily for 30 consecutive days typically recognize repeatable setups more quickly than those relying on unstructured notes. Archive entries weekly to identify broader trends across market regimes.
Step-by-Step Daily Checklist
Morning phase (60 minutes total):
- Apply news filters and record relevant items (15 minutes).
- Review the three on-chain dashboards and note key deltas (30 minutes).
- Execute correlation checks against price charts (15 minutes).
Evening phase (20 minutes):
- Complete the review template with observations.
- Identify any process adjustments needed.
- Archive daily notes for weekly aggregation.
Building Long-Term Pattern Recognition
Beyond daily execution, aggregate insights weekly to surface higher-level trends. Compare weekly averages of active addresses and exchange flows against price performance. This aggregation reveals whether short-term signals are consistent with larger market structure. In 2026, several traders reported improved positioning accuracy after implementing weekly reviews alongside the daily routine.
Common Beginner Mistakes – FAQ
How many dashboards should I monitor daily?
Three remains optimal. Expanding beyond this threshold increases cognitive load and reduces the ability to act decisively on the most relevant signals.
Should I react to every news headline?
No. Maintain strict filters and require on-chain confirmation before making any position adjustments. Reactive trading based solely on headlines frequently leads to poor timing.
What if on-chain data contradicts price action?
Treat divergence as a cue to pause rather than trade immediately. Wait for subsequent sessions to show alignment before committing capital.
How long does it take to see results from this workflow?
Most traders notice improved pattern recognition within two to four weeks of consistent use. The value compounds as historical notes accumulate.
Conclusion
A structured daily workflow transforms fragmented Bitcoin data into coherent, repeatable insights. By systematically applying news filters, on-chain dashboard reviews, correlation checks, and evening reflections, traders build decision-making processes that remain effective across varying market conditions in 2026 and beyond.

No comments yet. Be the first!