 CryptoChain Blog
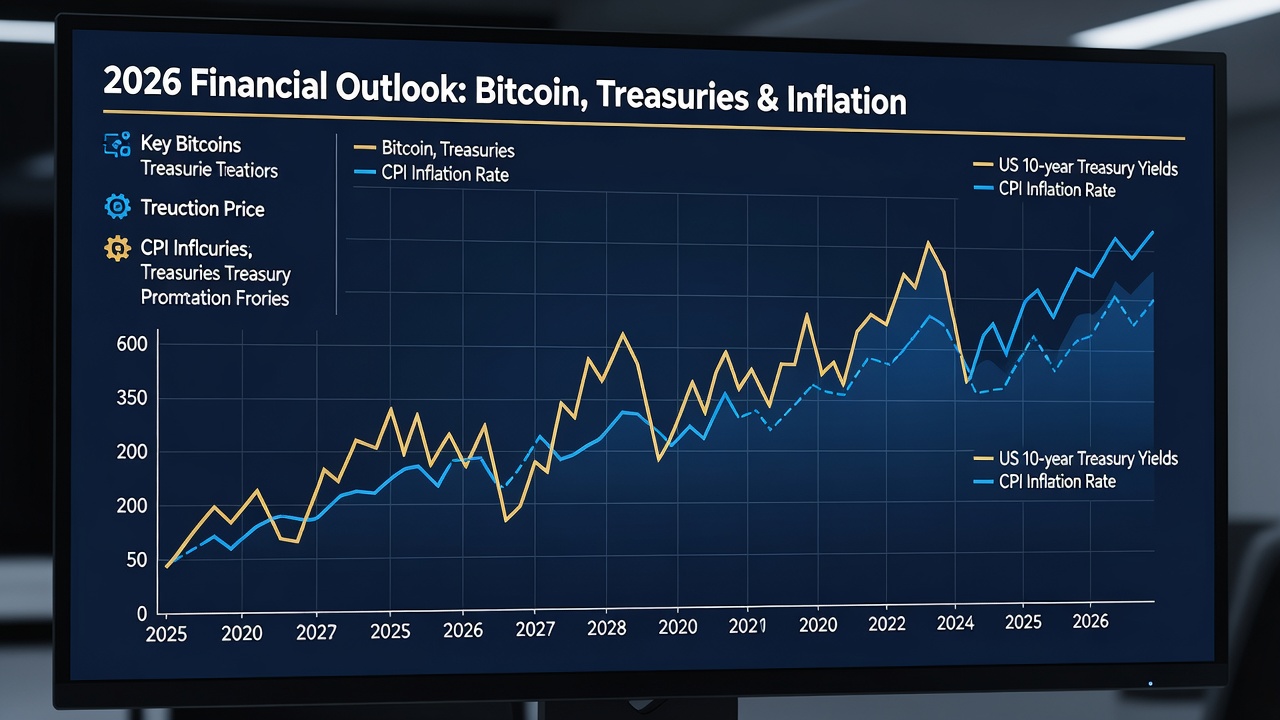
Introduction to Bitcoin Macro Correlations in 2026
Bitcoin continues to evolve as a macro-sensitive asset in 2026, with its price movements increasingly tied to global economic indicators. Traders seeking data-driven insights must understand how factors like interest rates and inflation influence BTC. This guide blends advanced correlation analysis with beginner-friendly explanations to help you build robust forecasting models. As institutional participation grows, ignoring macroeconomic variables can lead to incomplete trading strategies. Throughout this article we examine correlation coefficients, reliable data sources, practical calculation methods, and real-world 2026 case studies that demonstrate how macro shifts translate into Bitcoin price action.
Understanding Bitcoin's Evolving Role in the Global Economy
Bitcoin began as a decentralized payment network but has matured into a recognized macro asset class. In 2026 its daily trading volume frequently exceeds many traditional equity indices, making it sensitive to policy announcements from major central banks. Correlation analysis reveals periods when BTC behaves like a risk asset and other periods when it acts as an inflation hedge. Recognizing these regime shifts allows traders to adjust exposure dynamically rather than relying on static assumptions.
Key Macro Indicators Influencing Bitcoin
Understanding the primary drivers is essential. Interest rates set by central banks affect risk appetite, while inflation erodes purchasing power and can drive investors toward alternative stores of value. Other indicators include GDP growth, unemployment rates, and commodity prices such as gold and oil.
Interest Rates and BTC Sensitivity
Changes in the federal funds rate often create inverse correlations with Bitcoin. When rates rise, borrowing costs increase and speculative assets like BTC may face selling pressure. Conversely, rate cuts tend to support risk-on environments. In 2026, markets closely watched every Federal Open Market Committee meeting for clues about future policy direction.
Inflation Dynamics
Persistent inflation can boost Bitcoin's appeal as digital gold. Monitoring CPI and PCE data helps quantify this relationship through correlation coefficients. Traders compare year-over-year inflation prints against Bitcoin's 90-day rolling returns to identify leading or lagging relationships.
Additional Indicators Worth Tracking
Unemployment figures and PMI surveys often precede shifts in monetary policy. Strong employment data can signal higher future rates, while weakening PMI readings may foreshadow easing cycles that support Bitcoin prices. Commodity correlations, particularly with gold, provide further context during geopolitical stress events.
Advanced Correlation Analysis Techniques
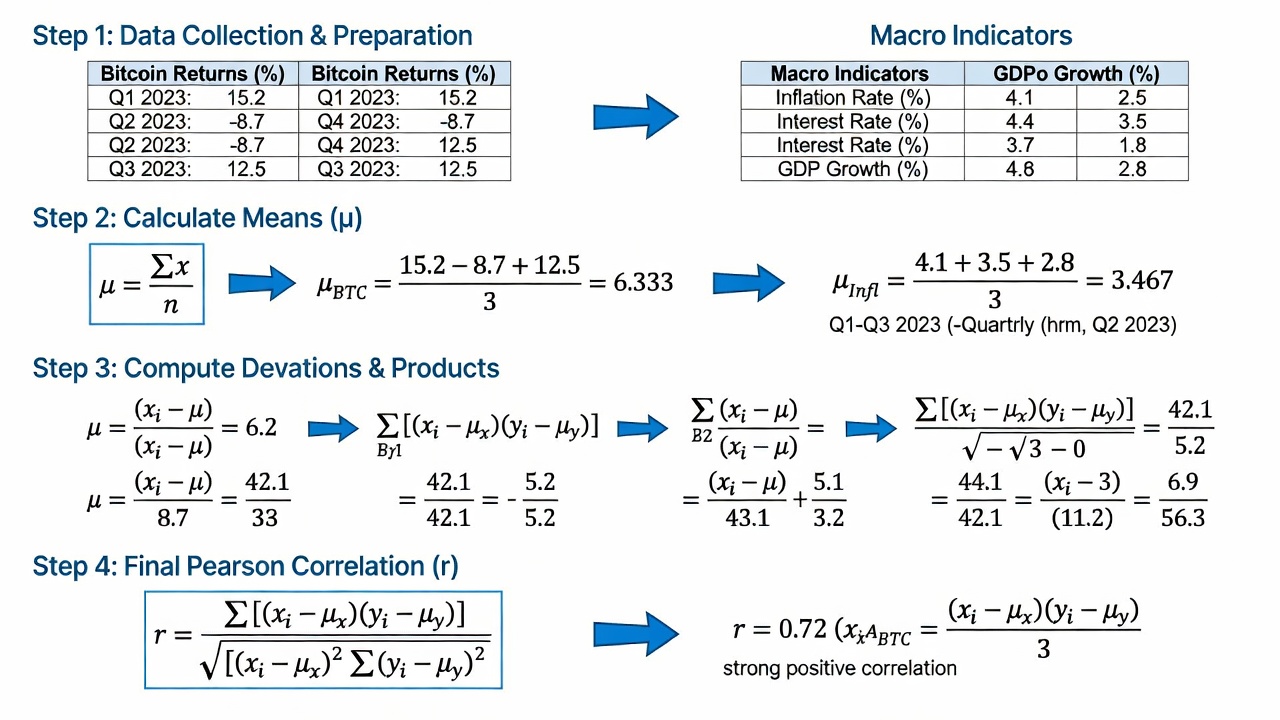
Traders can compute Pearson correlation coefficients using historical price and macro data. Here is a practical workflow:
- Collect daily closing prices for Bitcoin and corresponding macro series over a 90-day window.
- Normalize the datasets by calculating percentage changes to remove scale differences.
- Apply the Pearson formula: r = cov(X,Y) / (std(X) * std(Y)).
- Interpret results: values near +1 indicate strong positive correlation, near -1 show inverse relationships, and values near zero suggest little linear relationship.
- Repeat the process with rolling windows of 30, 60, and 180 days to detect changing regimes.
Advanced practitioners also apply Spearman rank correlation to capture non-linear relationships and compare results across multiple timeframes for robustness.
Real-Time Data Sources for Accurate Analysis
Reliable data underpins every successful model. Use FRED for macroeconomic series and on-chain analytics platforms for Bitcoin metrics. Cross-reference with official releases from the Federal Reserve and the International Monetary Fund. Many analysts also pull Bitcoin price data directly from major exchanges via APIs to ensure synchronization with macro release timestamps.
Case Studies: 2026 Macro Events and BTC Reactions
During the first quarter of 2026, stronger-than-expected CPI readings coincided with a short-term rally in Bitcoin as traders anticipated continued inflation hedging demand. Later, when the Federal Reserve signaled two additional rate cuts, BTC experienced a sharp 12 percent advance within ten days, illustrating the inverse rate relationship in action. These episodes highlight the value of monitoring both the direction and magnitude of macro surprises.
Impact on BTC Price Movements
Correlation analysis helps anticipate volatility clusters. In early 2026, for example, rising core inflation readings coincided with BTC rallies above key resistance levels, demonstrating a positive short-term relationship. Conversely, unexpected hawkish comments from central bank officials often triggered rapid deleveraging across crypto markets. Understanding these patterns enables traders to position ahead of scheduled data releases rather than reacting after the fact.
Building an Actionable BTC Analysis Workflow
Integrate macro data with Bitcoin news using this repeatable process:
- Download fresh macro releases each morning from official calendars.
- Run rolling 30-day and 90-day correlations between Bitcoin returns and key indicators.
- Overlay results with on-chain metrics such as exchange flows and whale accumulation patterns.
- Cross-check sentiment from reputable Bitcoin news outlets to confirm or contradict quantitative signals.
- Adjust position sizing based on correlation strength, volatility expectations, and upcoming event risk.
- Document each trade thesis with the specific macro data points that supported the decision.
Following this workflow consistently improves decision quality over time and creates an auditable record for strategy refinement.
Common Analysis Pitfalls and How to Avoid Them
Many analysts fall into traps such as using insufficient sample sizes or ignoring regime shifts. Always test correlations across multiple timeframes and validate findings with out-of-sample data. Another frequent mistake is confusing correlation with causation; a high coefficient does not prove that macro data directly drives Bitcoin prices. Additionally, traders sometimes overlook data revisions that can retroactively change historical correlation values. Finally, failing to account for weekend gaps in Bitcoin trading versus weekday-only macro releases can distort results.
Frequently Asked Questions
What is a strong correlation value for Bitcoin and interest rates?
Values above 0.6 or below -0.6 are generally considered meaningful for trading decisions, though statistical significance testing should accompany any threshold.
How often should I recalculate correlations?
Recalculate at least weekly, or immediately after major central bank announcements and inflation releases that may alter market regimes.
Can macro correlations predict exact price targets?
They provide probabilistic context rather than precise forecasts; combine them with technical analysis and on-chain metrics for better results.
Should I use Pearson or Spearman correlation for Bitcoin analysis?
Start with Pearson for linear relationships, then apply Spearman when scatter plots suggest non-linear patterns or when data contains outliers.
How do I handle data gaps between macro releases and crypto trading hours?
Use forward-filled or interpolated values sparingly and always note any assumptions in your methodology documentation.
Conclusion
Mastering Bitcoin macro correlations equips traders with a powerful edge in 2026. By following structured workflows, leveraging authoritative data sources, and avoiding common pitfalls, you can improve forecasting accuracy and make more informed decisions. Continuous refinement of these techniques will remain essential as Bitcoin's integration with traditional financial markets deepens.

No comments yet. Be the first!