 CryptoChain Blog

Introduction to Bitcoin Halving Cycles and 2026 Preparation
Bitcoin halvings occur approximately every four years, reducing the block reward and influencing supply dynamics. As we approach 2026, analysts are focusing on preparatory strategies for the 2028 halving. This article examines forward-looking approaches based on current market data, helping traders position themselves effectively. The halving mechanism is coded into Bitcoin's protocol to control inflation, cutting the reward for miners by half each time. This scarcity driver has historically led to price cycles, but 2026 conditions include higher institutional participation, regulatory clarity in major markets, and evolving macroeconomic factors that require updated analytical frameworks.
Understanding these cycles requires blending historical insights with modern on-chain metrics. Past events like the 2012, 2016, and 2020 halvings provide patterns, but 2026 conditions demand adaptation to institutional involvement and regulatory shifts. Traders who begin analysis now can identify accumulation phases early, potentially gaining advantages by 2028. The preparatory window in 2026 allows for building robust models that account for both on-chain fundamentals and external influences like global liquidity trends.
Key On-Chain Indicators for Pre-Halving Analysis
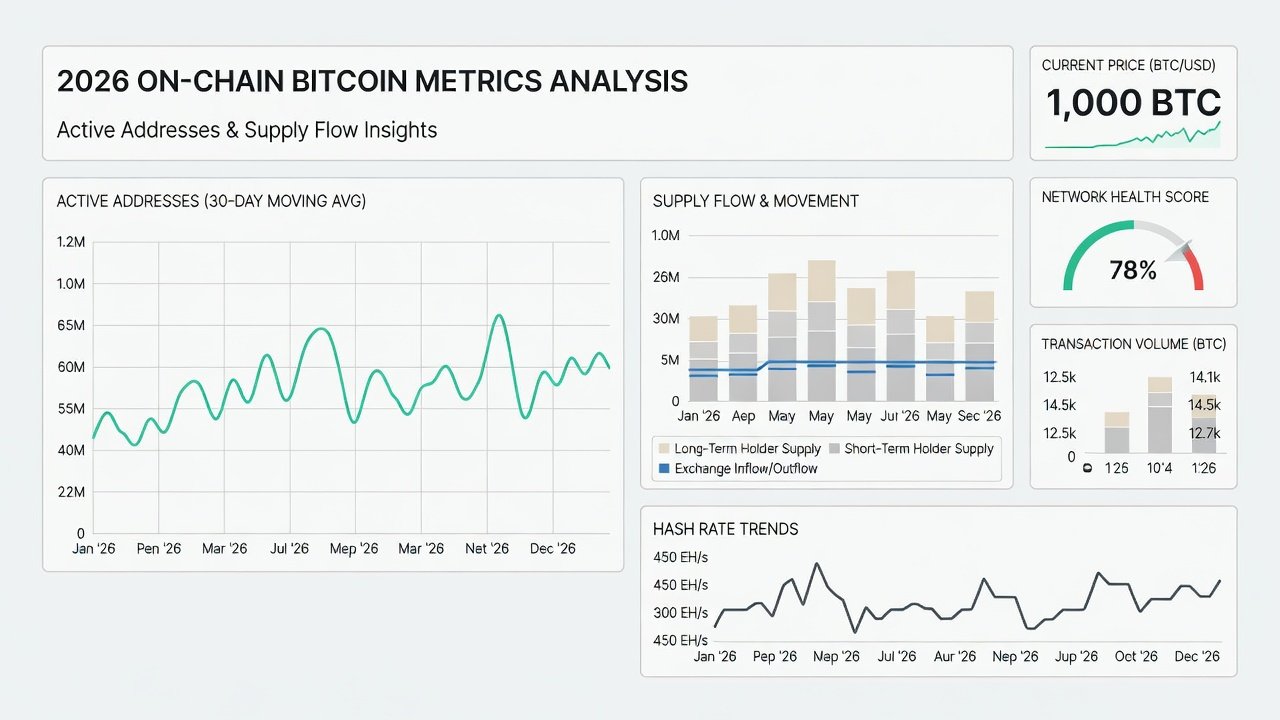
On-chain data offers transparent views of network health. Key metrics include active addresses, transaction volume, and realized price. In 2026, monitoring the MVRV ratio helps identify accumulation zones similar to pre-2020 patterns. Additional indicators such as the Spent Output Profit Ratio (SOPR) and the Puell Multiple provide insights into miner profitability and market cycles. For instance, tracking the number of addresses holding over 1,000 BTC can signal large-scale accumulation by whales or institutions.
Supply dynamics play a central role. The stock-to-flow model, though debated, highlights scarcity effects post-halving. Traders should track exchange reserves and long-term holder behavior for signals of distribution or accumulation phases. Realized capitalization, which adjusts for coin movement, often diverges from market cap during pre-halving periods, offering early warning signs of trend shifts. In 2026, combining these with layer-2 activity metrics gives a fuller picture of network usage and potential demand surges.
Historical Pattern Comparisons Adapted to 2026
Comparing cycles reveals recurring themes: price appreciation often accelerates 12-18 months before halvings. Adapting 2020 data to 2026 involves factoring in ETF inflows and macroeconomic conditions. For example, the 2016 cycle showed steady accumulation; today's environment may amplify this due to broader adoption. The 2012 halving preceded a massive rally driven by retail interest, while 2020 incorporated institutional elements that reshaped the recovery phase.
Real-world examples include whale wallet movements observed in prior cycles, now cross-referenced with 2026 derivatives data for more precise forecasting. During the 2016-2017 period, long-term holders accumulated heavily in the 12 months leading up to the event. Applying similar logic in 2026 means watching for similar wallet clustering patterns alongside ETF flow data. These comparisons help calibrate expectations while acknowledging that market maturity may shorten or extend certain phases compared to earlier cycles.
Building Custom Dashboards: Step-by-Step Guide
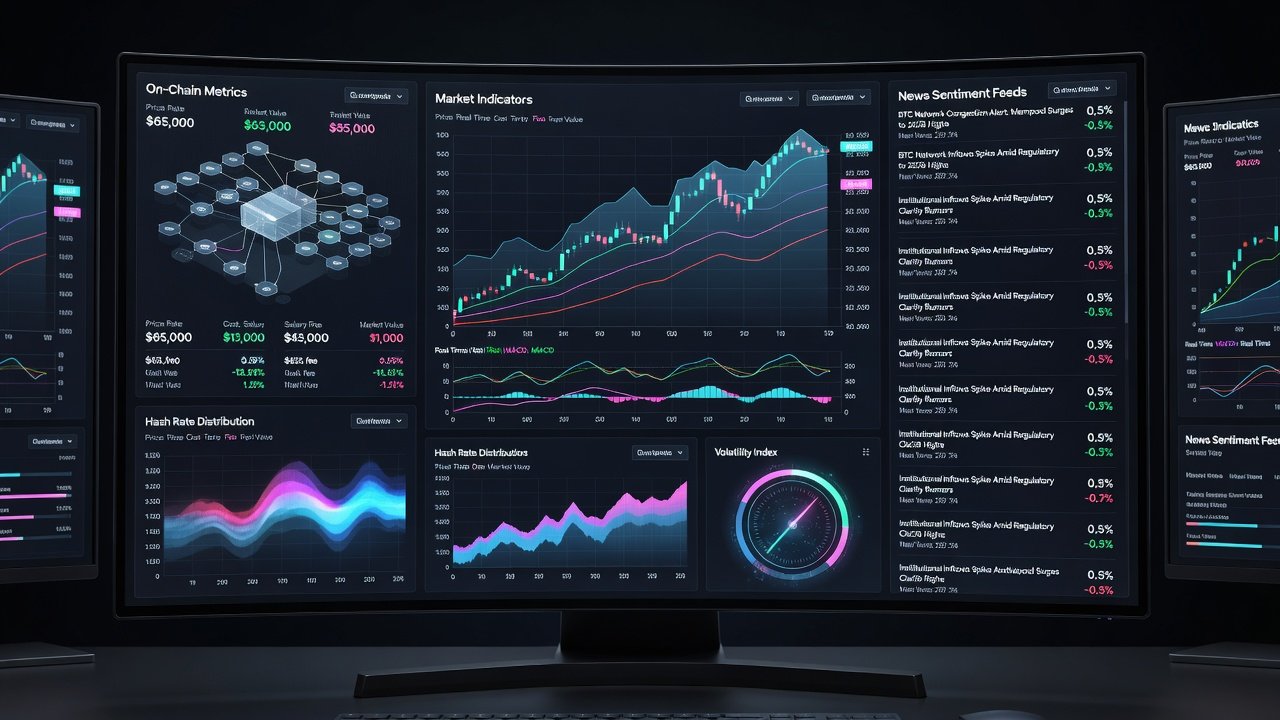
Creating personalized tracking tools is essential. Follow these steps:
- Select data sources such as public blockchain explorers and aggregate them into a unified view. Begin by pulling raw data from multiple endpoints and normalizing timestamps for consistency.
- Integrate indicators like SOPR and Puell Multiple using spreadsheet tools or open-source platforms. Set up automated scripts to refresh data daily and calculate ratios automatically.
- Set alerts for accumulation thresholds based on historical averages from past cycles. Define custom parameters, such as when exchange outflows exceed a 30-day moving average.
- Visualize supply shock scenarios with charts comparing current circulating supply to projected post-2028 levels. Include scenario modeling for different adoption rates and regulatory outcomes.
- Backtest your dashboard against 2016 and 2020 data to validate signal accuracy before applying it to 2026 conditions.
- Incorporate external feeds for macroeconomic variables like interest rate expectations to contextualize on-chain signals.
This method allows real-time monitoring of pre-halving phases, turning raw data into actionable insights. Regular refinement ensures the dashboard evolves with new data sources and market developments.
Risk Factors in the 2026-2028 Window
Volatility remains a core risk. Regulatory changes, global liquidity shifts, and technological upgrades can disrupt expected patterns. Potential delays in Bitcoin protocol upgrades or unexpected policy announcements from major economies could alter cycle timing. Geopolitical events may also influence risk appetite and capital flows into digital assets.
Traders must account for black swan scenarios, such as sudden exchange failures or major security incidents, which have occurred in previous cycles. Monitoring network hash rate distribution helps assess centralization risks that could affect security perceptions around the halving period.
Portfolio Adjustments and Practical Strategies
Portfolio strategies include gradual accumulation during identified phases and hedging with options. Avoid over-leveraging, as historical drawdowns have exceeded 70% in prior cycles. Consider dollar-cost averaging into positions while maintaining liquidity buffers for opportunistic entries during corrections. Rebalance allocations quarterly based on dashboard signals rather than emotional responses to short-term price action.
Real-world application in 2026 might involve allocating a portion of holdings to Bitcoin while diversifying into related assets that historically correlate during halving periods. Stress testing portfolios against multiple historical scenarios builds resilience ahead of 2028 volatility.
FAQs on Timing Entries for 2028 Advantages
- When should accumulation begin? Monitor 2026 indicators for early signals, typically 18 months pre-halving, adjusting for current market maturity.
- How do on-chain metrics differ today? Increased transparency from institutional wallets provides clearer accumulation data than in earlier cycles, allowing for more granular tracking.
- What mistakes should traders avoid? Ignoring macroeconomic overlays and chasing short-term hype instead of cycle-aligned strategies often leads to suboptimal timing.
- How reliable are historical comparisons? They serve as useful guides but must be adjusted for differences in adoption levels, regulatory environments, and technological infrastructure present in 2026.
Conclusion
Preparing for the 2028 Bitcoin halving starts with robust 2026 analysis. By leveraging on-chain tools, historical adaptations, and custom dashboards, traders can navigate risks and optimize entries. Continuous learning through authoritative resources like bitcoin.org and staying informed via established financial oversight bodies such as sec.gov and federalreserve.gov supports informed decision-making in this evolving landscape. Implementing these strategies positions participants for potential advantages as the cycle progresses toward 2028.
No comments yet. Be the first!