 CryptoChain Blog
Introduction to Custom Bitcoin Dashboards in 2026
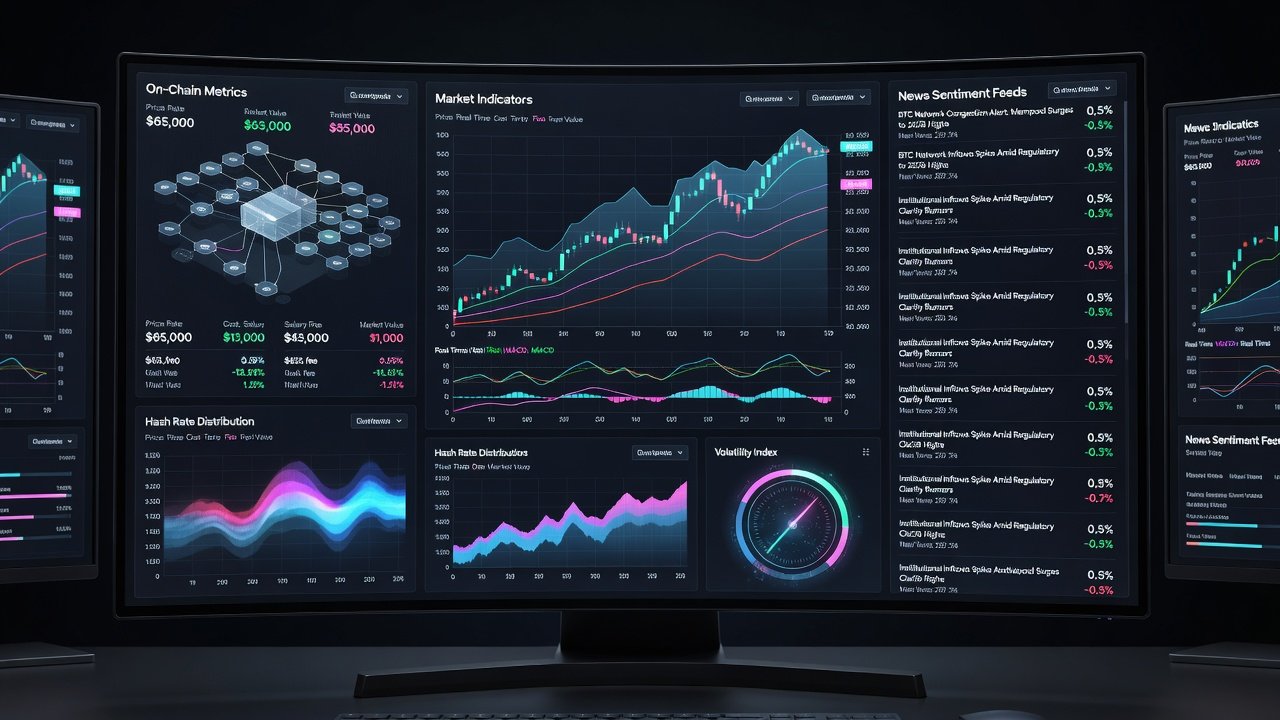
Creating a personalized Bitcoin analysis dashboard allows traders and analysts to combine on-chain metrics, market indicators, and sentiment data without relying on generic platforms. In 2026, free and open-source tools make this more accessible than ever, enabling unique insights tailored to individual strategies. This comprehensive approach helps users move beyond surface-level price tracking to understand the underlying drivers of Bitcoin's value and network activity.
This guide covers selecting essential metrics, setting up with Python or no-code options, integrating real-time APIs, and building visualizations that support informed trading decisions. By the end, you will have a fully functional system that evolves with the market and your specific needs.
Why Build a Custom Dashboard Instead of Using Existing Tools
Pre-built dashboards often overlap in features and lack flexibility for niche analysis. A custom setup lets you focus on specific data points like Bitcoin's realized price or exchange flows while incorporating unique news sentiment feeds. This approach avoids redundancy and provides competitive edges in volatile markets. Many popular platforms aggregate the same public data, leading to identical insights across users. Custom development ensures your dashboard highlights correlations or anomalies that matter most to your trading style.
Selecting Key Metrics for Your Bitcoin Dashboard
Focus on three core categories to ensure comprehensive coverage without unnecessary complexity. On-chain data reveals network fundamentals, market indicators capture trading dynamics, and news sentiment adds qualitative context. Together these create a multi-dimensional view of Bitcoin.
- On-chain data: Track metrics such as active addresses, hash rate, transaction volume, and realized capitalization for insights into network health and holder behavior. For example, a sudden spike in active addresses often precedes increased volatility.
- Market indicators: Include price action, volatility indexes, funding rates, and open interest to gauge trading momentum and potential leverage build-ups.
- News sentiment feeds: Aggregate real-time Bitcoin news to measure market mood and potential catalysts. Sentiment scores can help anticipate reactions to regulatory announcements or institutional moves.
These elements work together to reveal patterns that single-source tools might miss, such as divergences between on-chain accumulation and negative news sentiment.
Choosing Your Development Approach: Python or No-Code
Python offers maximum customization through libraries like pandas for data handling and Plotly for interactive charts. It supports complex calculations and easy integration with machine learning models. No-code platforms such as Streamlit or Retool provide quicker visual interfaces for beginners. Evaluate your coding comfort level before starting. Hybrid approaches are also possible, where you prototype in no-code and migrate key components to Python for deeper analysis.
Step-by-Step Python Setup for a Bitcoin Dashboard
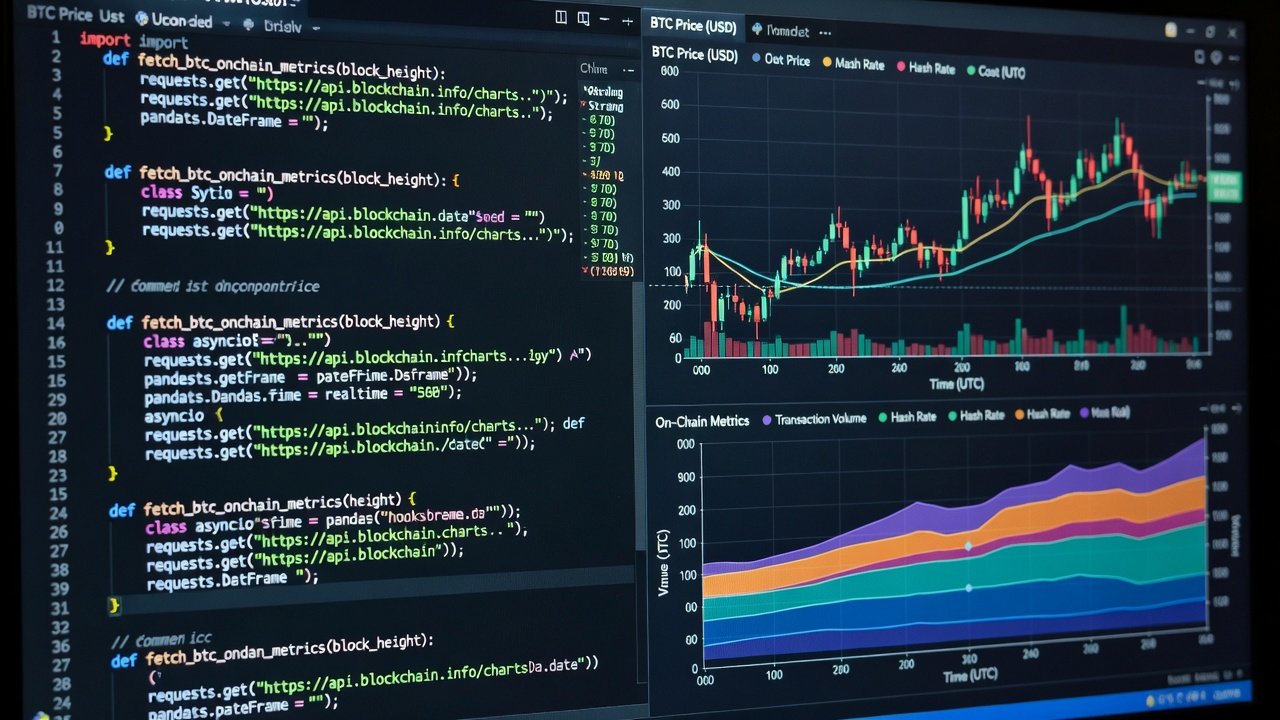
Begin by installing essential packages via pip: requests for API calls, pandas for processing, and dash for the web interface. Create a new project directory and initialize a virtual environment to manage dependencies cleanly. Next, pull data from sources like the Bitcoin.org ecosystem and public endpoints such as blockchain explorers. Structure your script to fetch hourly updates, clean the data by handling missing values, and render charts that update automatically. Test locally before deploying to a cloud service for 24/7 access. Add error handling to retry failed requests and log issues for debugging. An example script might start by importing libraries, defining API endpoints, and scheduling data refreshes every 15 minutes using the schedule module.
Integrating Real-Time Bitcoin News APIs
Connect news APIs to your dashboard for sentiment analysis. Use endpoints that deliver Bitcoin-specific headlines, then apply simple NLP techniques to score positivity or negativity. This layer adds context to raw price and on-chain numbers, helping anticipate shifts driven by external events. For instance, integrate feeds from reputable sources and process text with libraries like TextBlob to generate daily sentiment averages. Store historical sentiment data alongside price metrics to identify leading indicators. Ensure your integration respects rate limits and includes fallback mechanisms if an API becomes unavailable.
Visualizing Insights for Trading Decisions
Design clear charts that highlight correlations, such as overlaying hash rate trends with price movements. Use color-coded alerts for threshold breaches like hash rate drops below a moving average. Exportable reports make it easy to share findings or review historical performance. Interactive elements such as hover tooltips and date range selectors improve usability. Consider adding heatmaps to show sentiment across different news categories or candlestick charts combined with on-chain overlays for richer context.
Customization Tips and Practical Examples
Extend your dashboard by adding filters for time ranges or specific exchanges. For advanced users, incorporate machine learning models to predict short-term trends based on combined metrics. A beginner example might start with a single price chart plus on-chain summary, while experts can layer multiple sentiment sources and set automated alerts via email or Slack. One practical customization is creating a "whale watch" panel that flags large on-chain transfers. Another involves building a correlation matrix between Bitcoin and macroeconomic indicators pulled from public data sources. Test customizations incrementally to avoid overwhelming the interface.
Deployment and Maintenance Best Practices
Once the core dashboard is functional, deploy it using services like Heroku or a simple VPS. Set up automated backups of your data and scripts. Regularly update libraries and API keys to maintain reliability. Monitor performance with logging tools and refine visualizations based on your usage patterns. This ongoing maintenance ensures your dashboard remains a reliable decision-support tool throughout 2026 and beyond.
Common Pitfalls and FAQ
FAQ Section
Q: What if my data sources go offline? A: Build redundancy with backup APIs and cache recent values locally so the dashboard continues to function during temporary outages.
Q: How do I handle API rate limits? A: Implement delays between requests and prioritize essential calls in your script while queuing less critical data pulls.
Q: Is this suitable for beginners? A: Start with no-code tools to learn concepts before moving to Python for more advanced features and full control.
Q: Can I add more cryptocurrencies later? A: Yes, modular code design makes expansion straightforward by reusing the same data fetching and visualization patterns.
Q: How often should I refresh data? A: Hourly updates work well for most users, but day traders may prefer 15-minute intervals with appropriate rate-limit handling.
Q: What security steps are recommended? A: Never hardcode API keys in scripts and use environment variables or secure vaults when deploying publicly.
Conclusion
Building your own Bitcoin analysis dashboard in 2026 empowers you with tailored, actionable intelligence. By combining on-chain data, market signals, and news sentiment through accessible tools, you gain a deeper understanding of BTC dynamics for smarter trading. The process rewards patience and iteration, ultimately delivering a unique competitive advantage in the evolving cryptocurrency landscape.

No comments yet. Be the first!